library(tidyverse)
library(ggformula)
library(mosaic)
library(broom)
library(knitr)
library(patchwork) #arrange plots in a gridAE 07: Model evaluation
Songs on Spotify
Important
Open RStudio and create a subfolder in your AE folder called “AE-07”.
Go to the Canvas and locate your
AE 07assignment to get started.Upload the
ae-07.qmdandspotify-popular.csvfiles into the folder you just created. The.qmdand PDF responses are due in Canvas. You can check the due date on the Canvas assignment.
Data
The data set for this assignment is a subset from the Spotify Songs Tidy Tuesday data set. The data were originally obtained from Spotify using the spotifyr R package.
It contains numerous characteristics for each song. You can see the full list of variables and definitions here. This analysis will focus specifically on the following variables:
| variable | class | description |
|---|---|---|
| track_id | character | Song unique ID |
| track_name | character | Song Name |
| track_artist | character | Song Artist |
| track_popularity | double | Song Popularity (0-100) where higher is better |
| energy | double | Energy is a measure from 0.0 to 1.0 and represents a perceptual measure of intensity and activity. Typically, energetic tracks feel fast, loud, and noisy. For example, death metal has high energy, while a Bach prelude scores low on the scale. Perceptual features contributing to this attribute include dynamic range, perceived loudness, timbre, onset rate, and general entropy. |
| valence | double | A measure from 0.0 to 1.0 describing the musical positiveness conveyed by a track. Tracks with high valence sound more positive (e.g. happy, cheerful, euphoric), while tracks with low valence sound more negative (e.g. sad, depressed, angry). |
spotify <- read_csv("spotify-popular.csv")Are high energy songs more positive? To answer this question, we’ll analyze data on some of the most popular songs on Spotify, i.e. those with track_popularity >= 80. We’ll use linear regression to fit a model to predict a song’s positiveness (valence) based on its energy level (energy).
Below are plots as part of the exploratory data analysis.
p1 <- gf_histogram(~valence, data = spotify) |>
  gf_labs(title = "Distribution of Valence",
       subtitle = " for Popular songs on Spotify",
       x = "Valence")

p2 <- gf_histogram(~energy, data = spotify) |>
  gf_labs(title = "Distribution of Energy",
       subtitle = "for Popular songs on Spotify",
       x = "Energy")
p1 + p2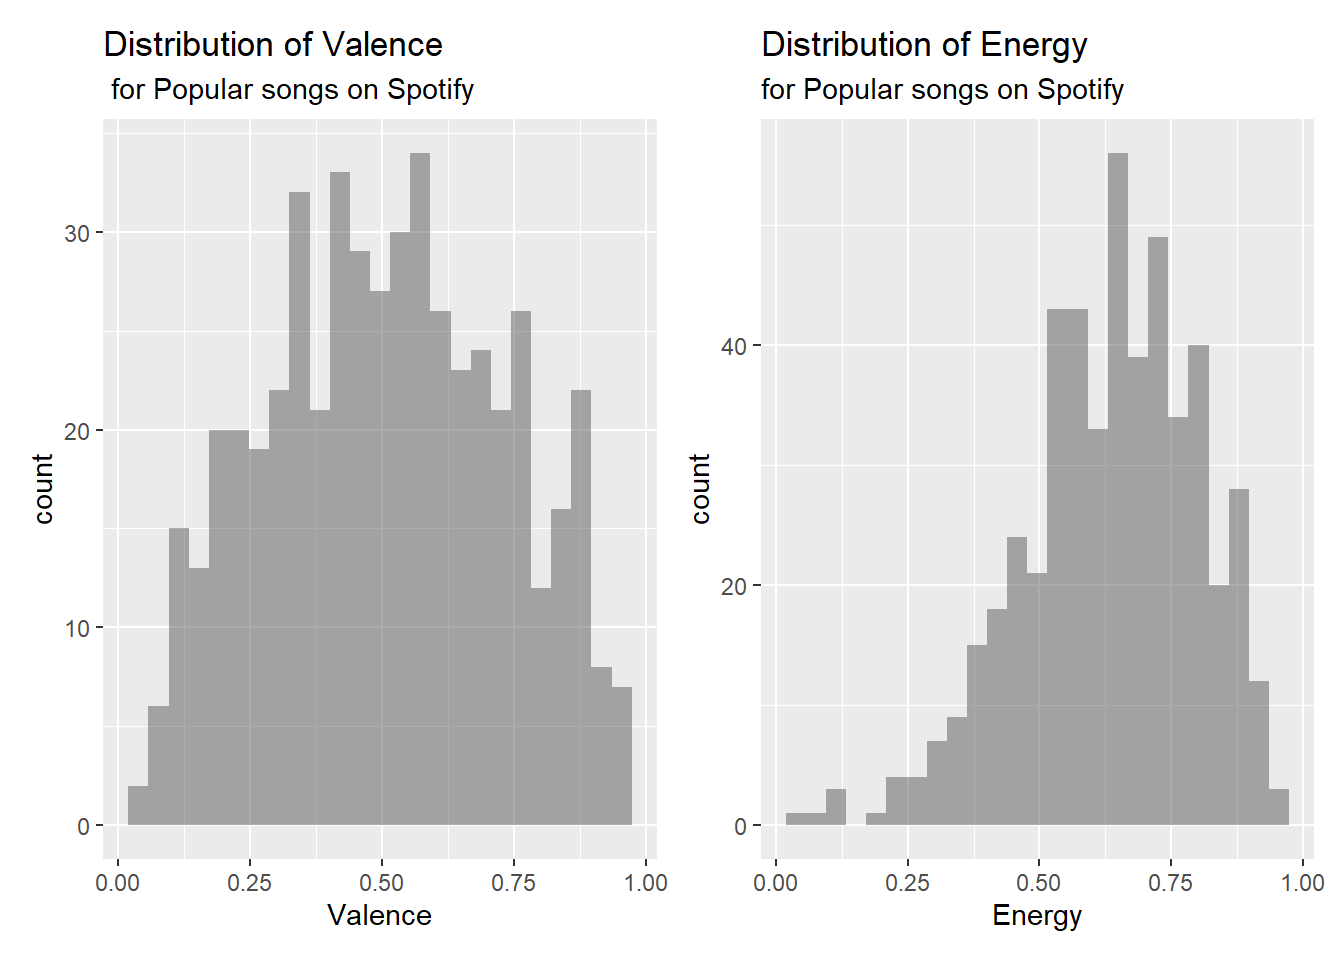
gf_point(valence ~ energy, data = spotify) |>
  gf_labs(title = "Valence vs. Energy",
       subtitle = "Popular songs on Spotify",
       x = "Energy",
       y = "Valence")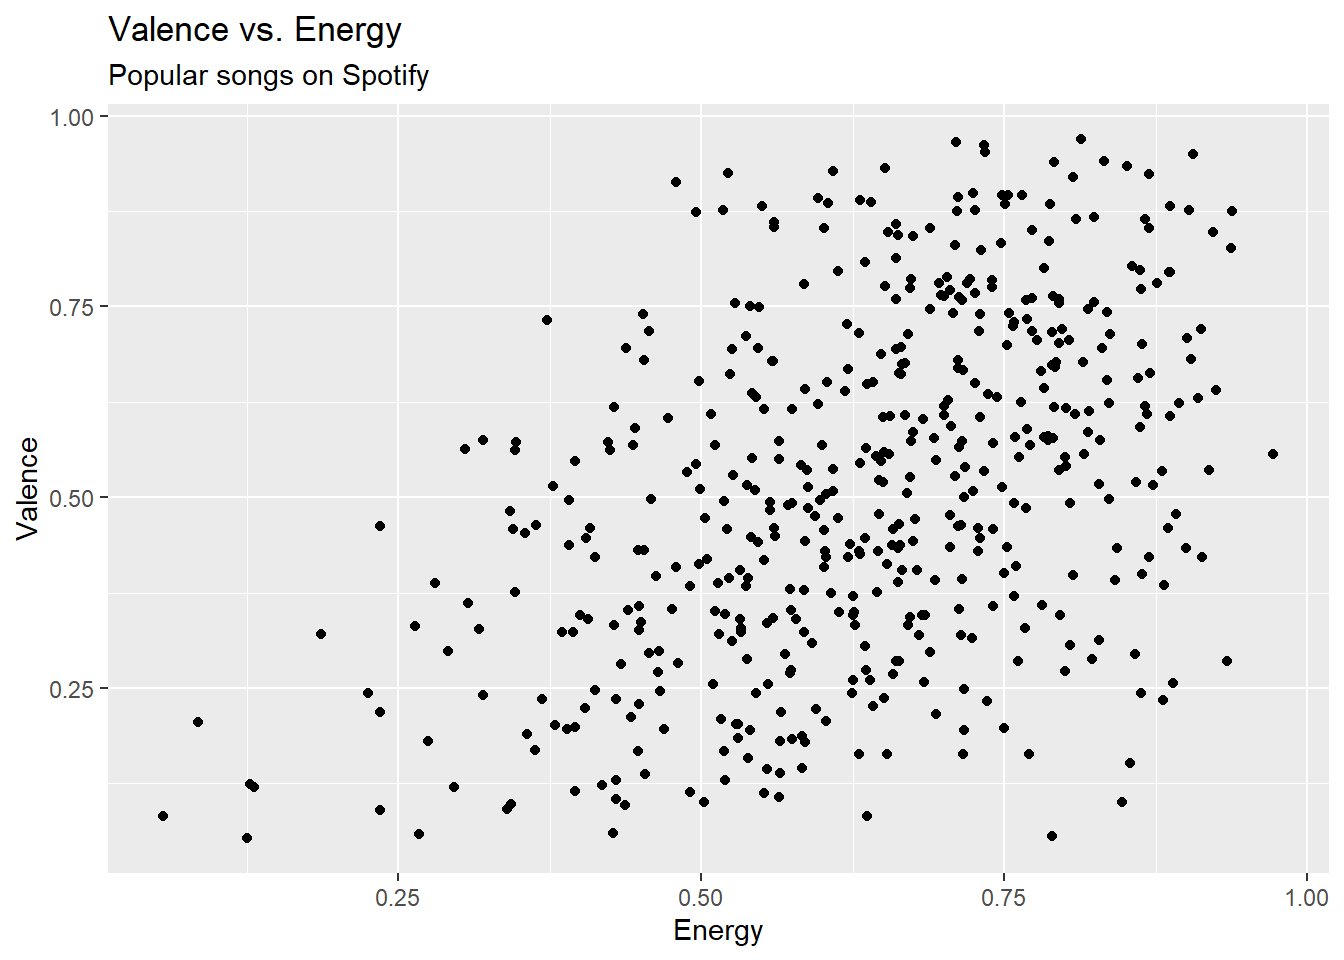
Model with 90% CI for coefficients
spotify_fit <- lm(valence ~ energy, data = spotify)

tidy(spotify_fit, conf.int = TRUE, conf.level = 0.9) |>
kable(digits = 3)| term | estimate | std.error | statistic | p.value | conf.low | conf.high |
|---|---|---|---|---|---|---|
| (Intercept) | 0.121 | 0.035 | 3.401 | 0.001 | 0.062 | 0.179 |
| energy | 0.614 | 0.054 | 11.321 | 0.000 | 0.525 | 0.703 |
Create augmented data frame
spotify_aug <- augment(spotify_fit)Create residual plots
gf_point(.resid ~ .fitted, data = spotify_aug) |>
  gf_hline(yintercept = 0, color = "red", linetype = "dashed") |>
  gf_labs(x = "Fitted values",
       y = "Residuals",
       title = "Residuals vs. fitted")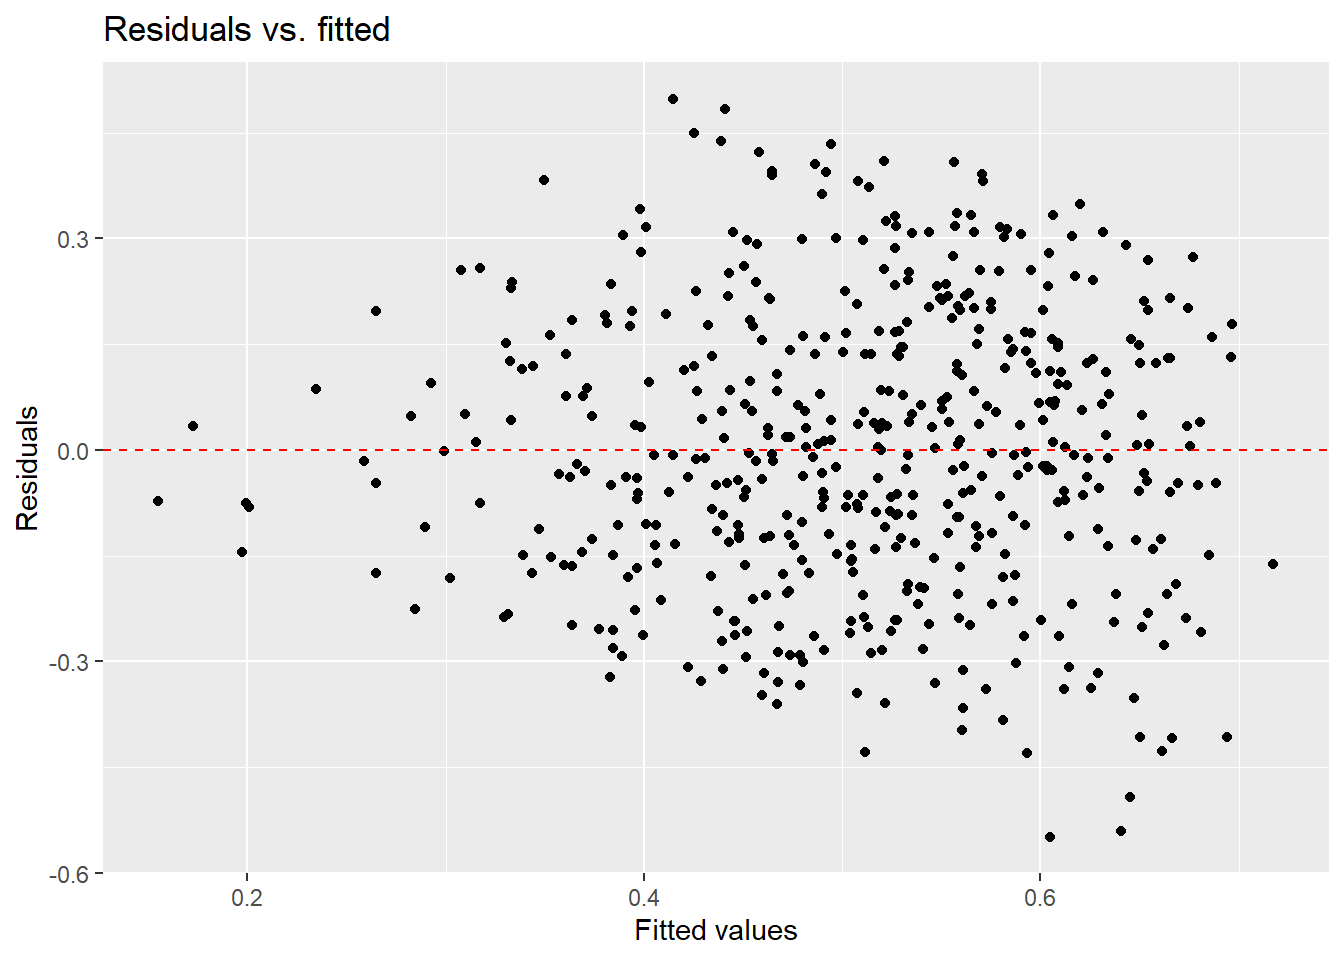
resid_hist <- gf_histogram(~.resid, data = spotify_aug) |>
  gf_labs(x = "Residuals",
       title = "Distribution of residuals")

resid_qq <- gf_qq(~.resid, data = spotify_aug) |>
  gf_qqline()  |>
  gf_labs(x = "Theoretical quantiles",
       y = "Observed residuals",
       title = "Normal QQ-plot")

resid_hist + resid_qq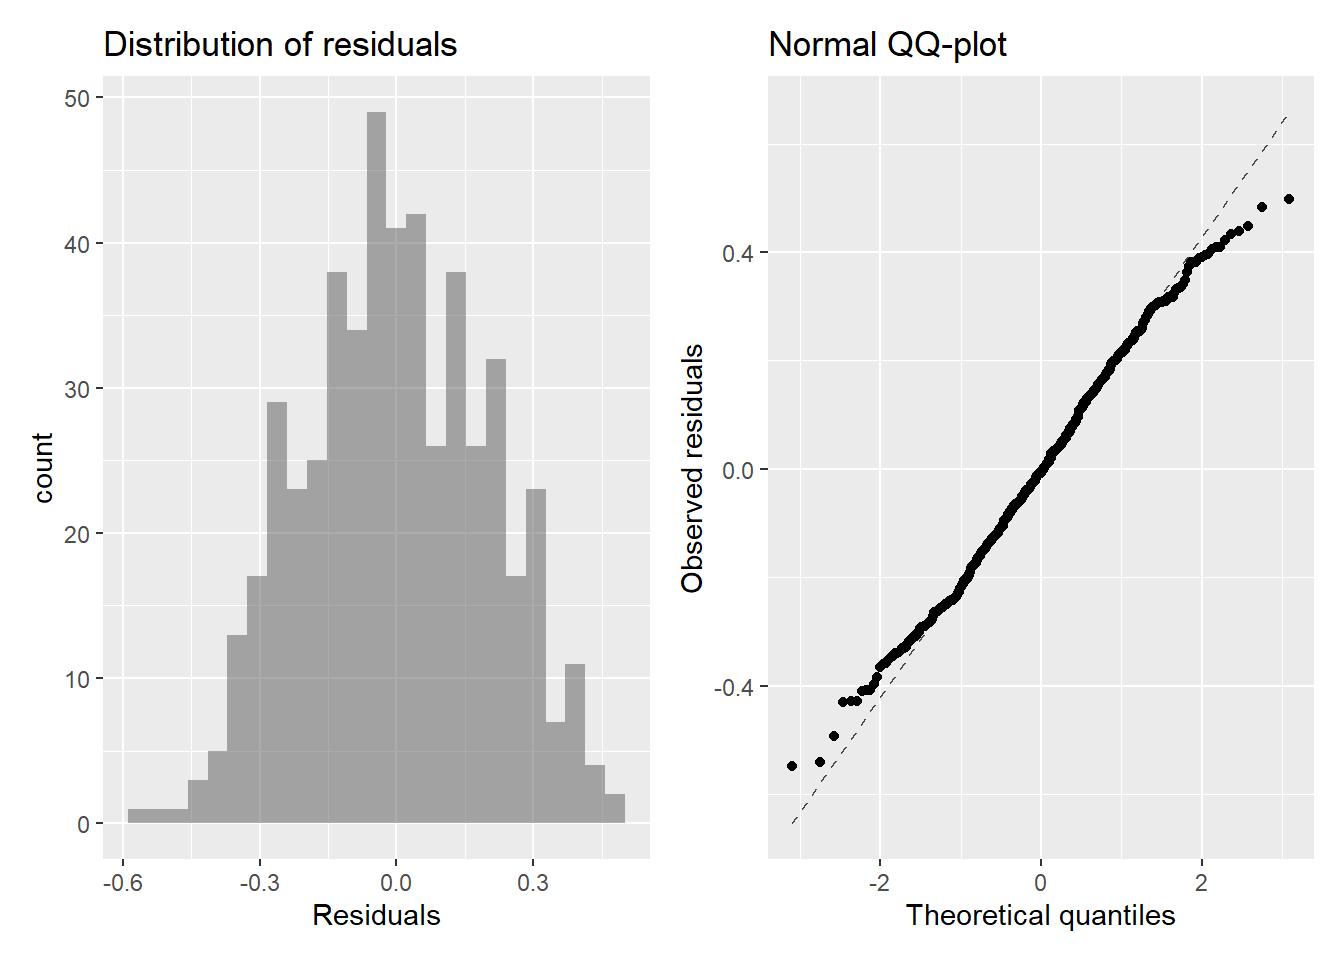
Exercise 1
Calculate \(R^2\) and interpret this value in the context of the data.
Exercise 2
Calculate RMSE and interpret this value in the context of the data.
Exercise 3
Choose another quantitative variable in the data set. Check here for specific definitions of variables. After Dr. Friedlander approves your choice, fit a model predicting valence using that variable as a predictor. Make an argument, citing quantitative evidence, for which model is better, the energy model or your new model. Reporters, be ready to discuss with the class.
To submit the AE:
Important
- Render the document to produce the PDF with all of your work from today’s class.
- Upload your QMD and PDF files to the Canvas assignment.