Analyzing Multivariable Relationships
Announcements
- Due Wednesday:
- HW 0 (3 .qmd, 3 .html, 6 files total uploaded to Canvas)
- Read Chapter 1.1 of text (see webstie for optional additional reading)
- Other Stuff:
- Tuesday (tomorrow) office hours rescheduled to 12:30-1:30pm
Questions from last class?
Multivariable relationships
Carbohydrates in Starbucks food
Starbucks often displays the total calories in their food items but not the other nutritional information.
Carbohydrates are a body’s main fuel source. The Dietary Guidelines for America recommend that carbohydrates make up 45% to 65% of total daily calories.1
Our goal is to understand the relationship between the amount of carbohydrates and calories in Starbucks food items. We’d also like to assess if the relationship differs based on the type of food item (bakery, salad, sandwich, etc.)
Starbucks data
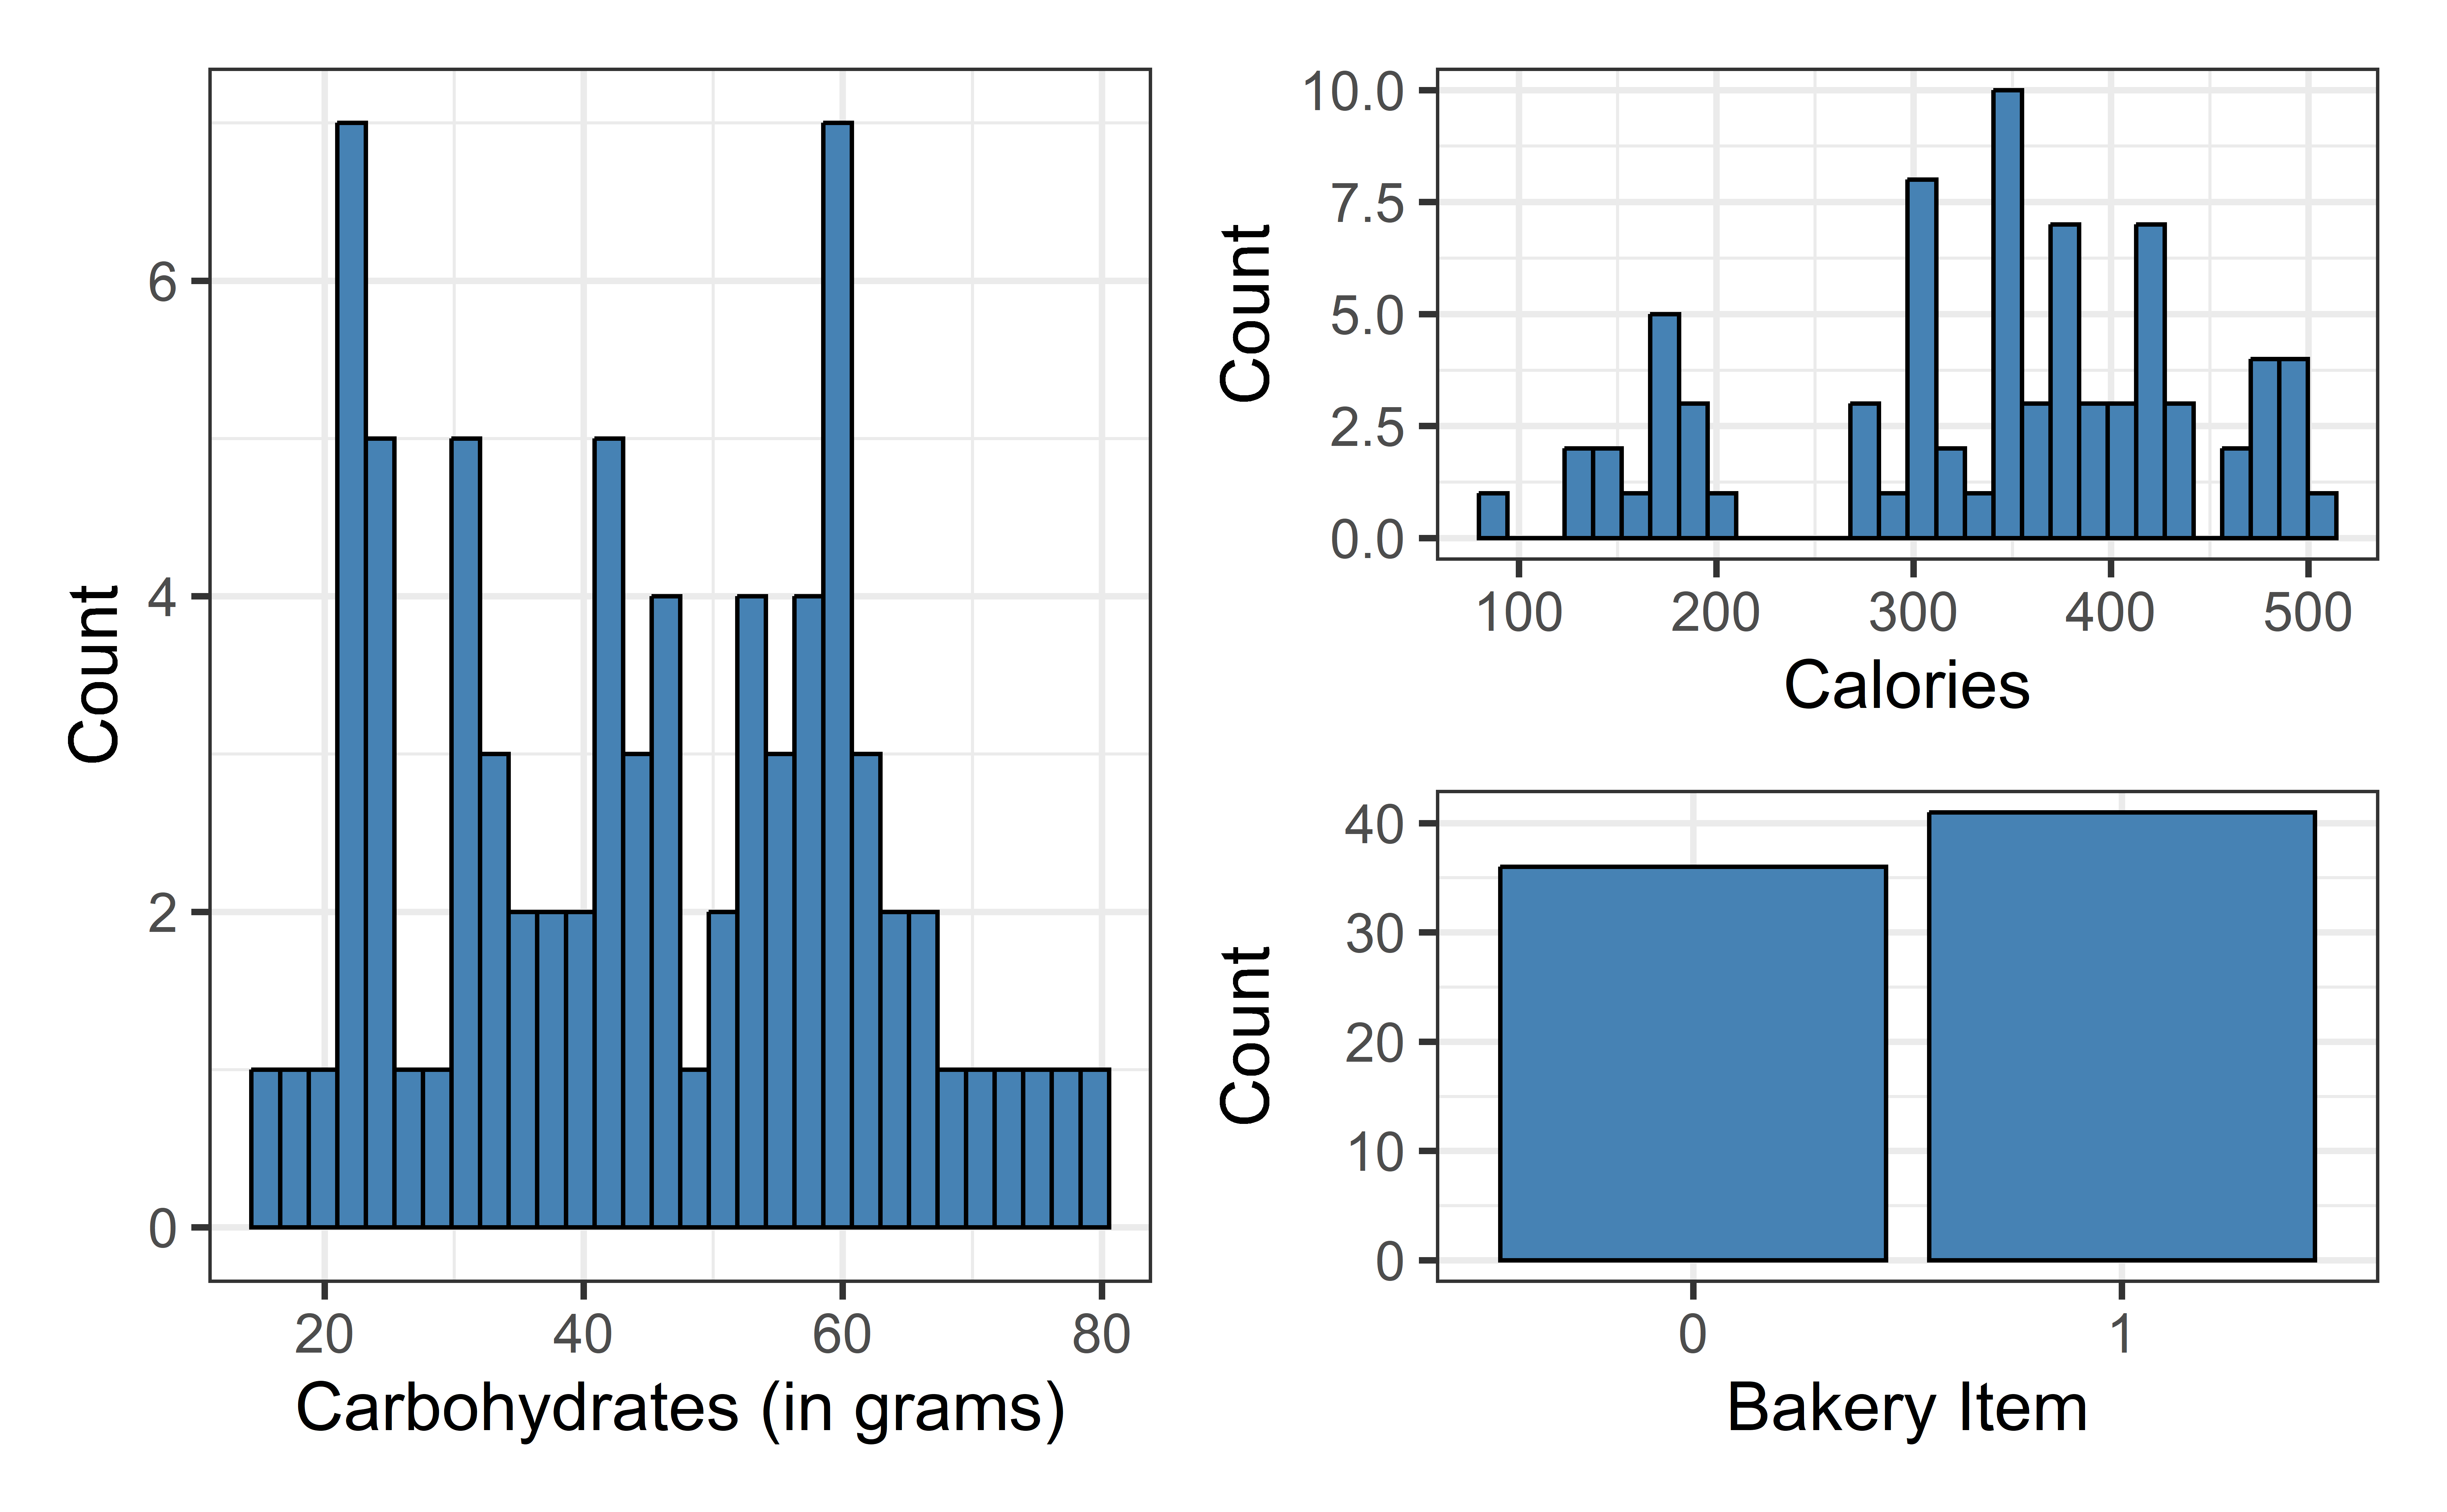
- Observations: 77 Starbucks food items
- Variables:
carb: Total carbohydrates (in grams)calories: Total caloriesbakery: 1: bakery food item, 0: other food type
Terminology
carbis the response variable- variable whose variation we want to understand / variable we wish to predict
- also known as outcome or target variable
. . .
calories,bakeryare the explanatory variables- variables used to account for variation in the response
- also known as predictor, or input variables
Univariate exploratory data analysis
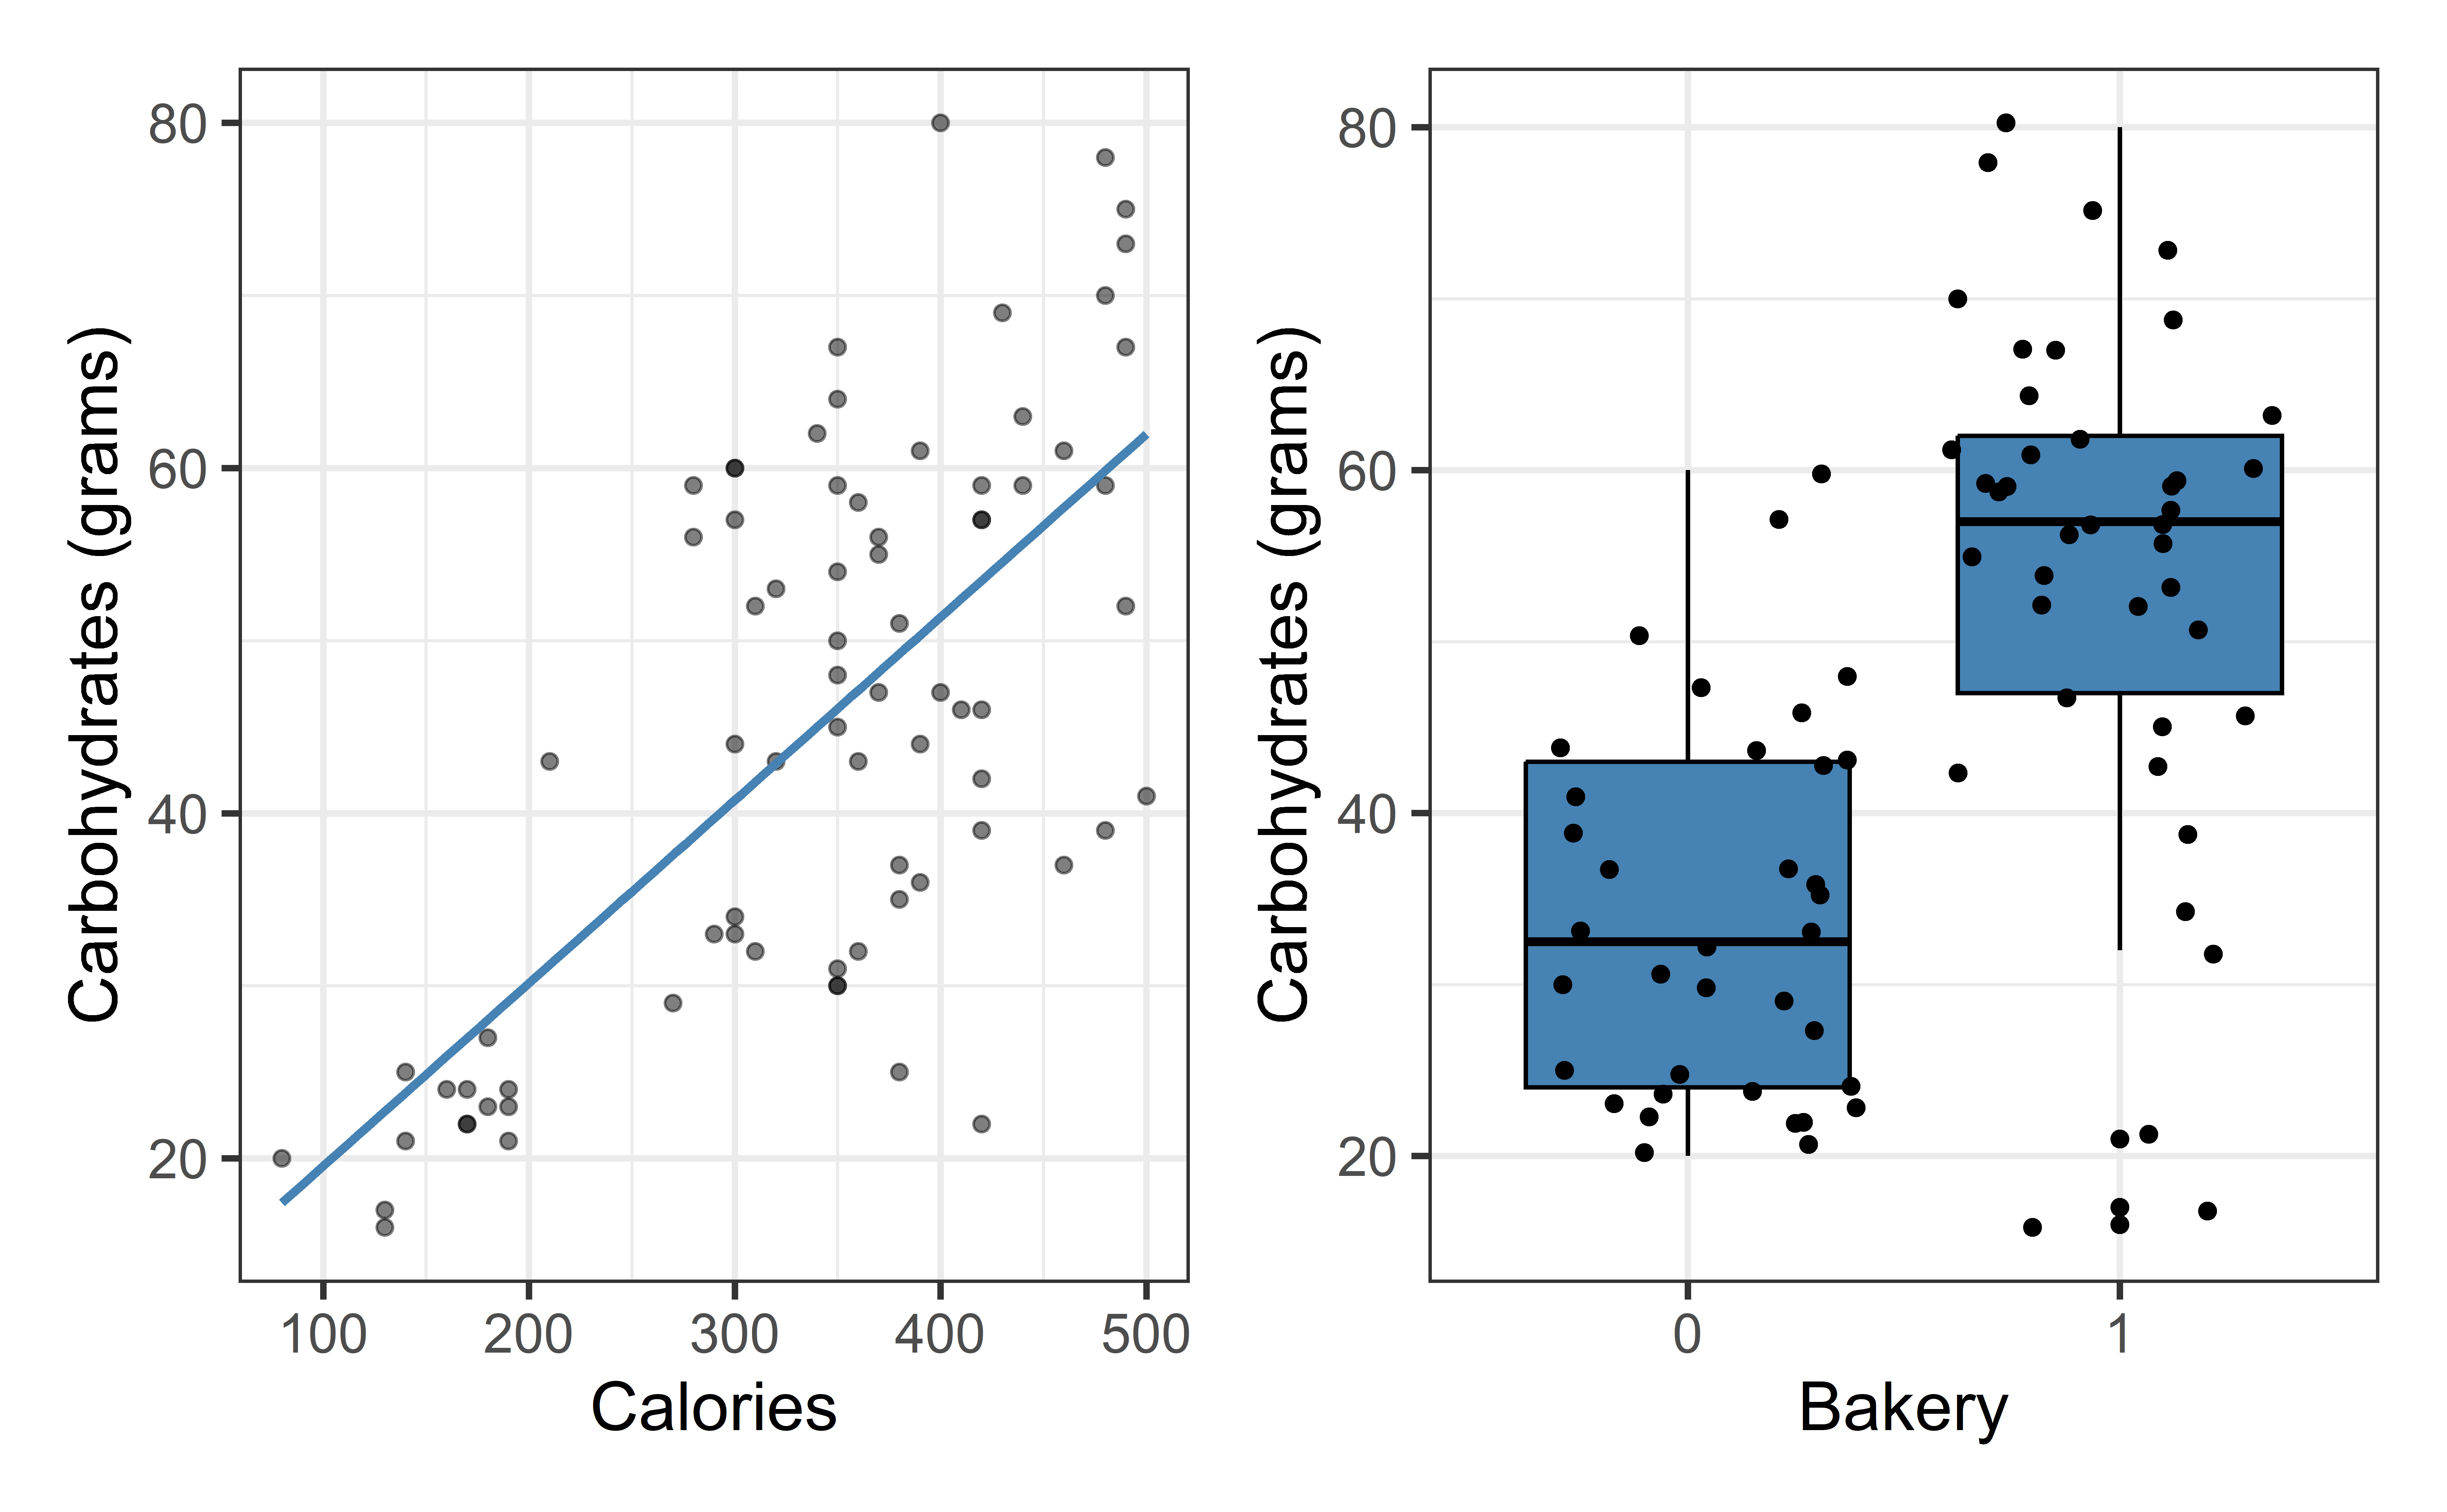
Bivariate exploratory data analysis
Function between response and predictors
\[\text{carb} = f(\text{calories}, \text{bakery}) + \epsilon\]
- Goal: Determine \(f\)
- How do we determine \(f\)?
- Make an assumption about the functional form \(f\) (parametric model)
- Use the data to fit a model based on that form
Determine \(f\)
- Choose the functional form of \(f\), i.e., choose the appropriate model given the response variable
- Suppose \(f\) takes the form of a linear model
\[y = f(\mathbf{X}) = \beta_0 + \beta_1 x_1 + \dots + \beta_p x_p + \epsilon\]
. . .
- Use the data to fit (or train) the model, i.e, estimate the model parameters, \(\beta_0, \beta_1, \ldots, \beta_p\)
Carb vs. Calories
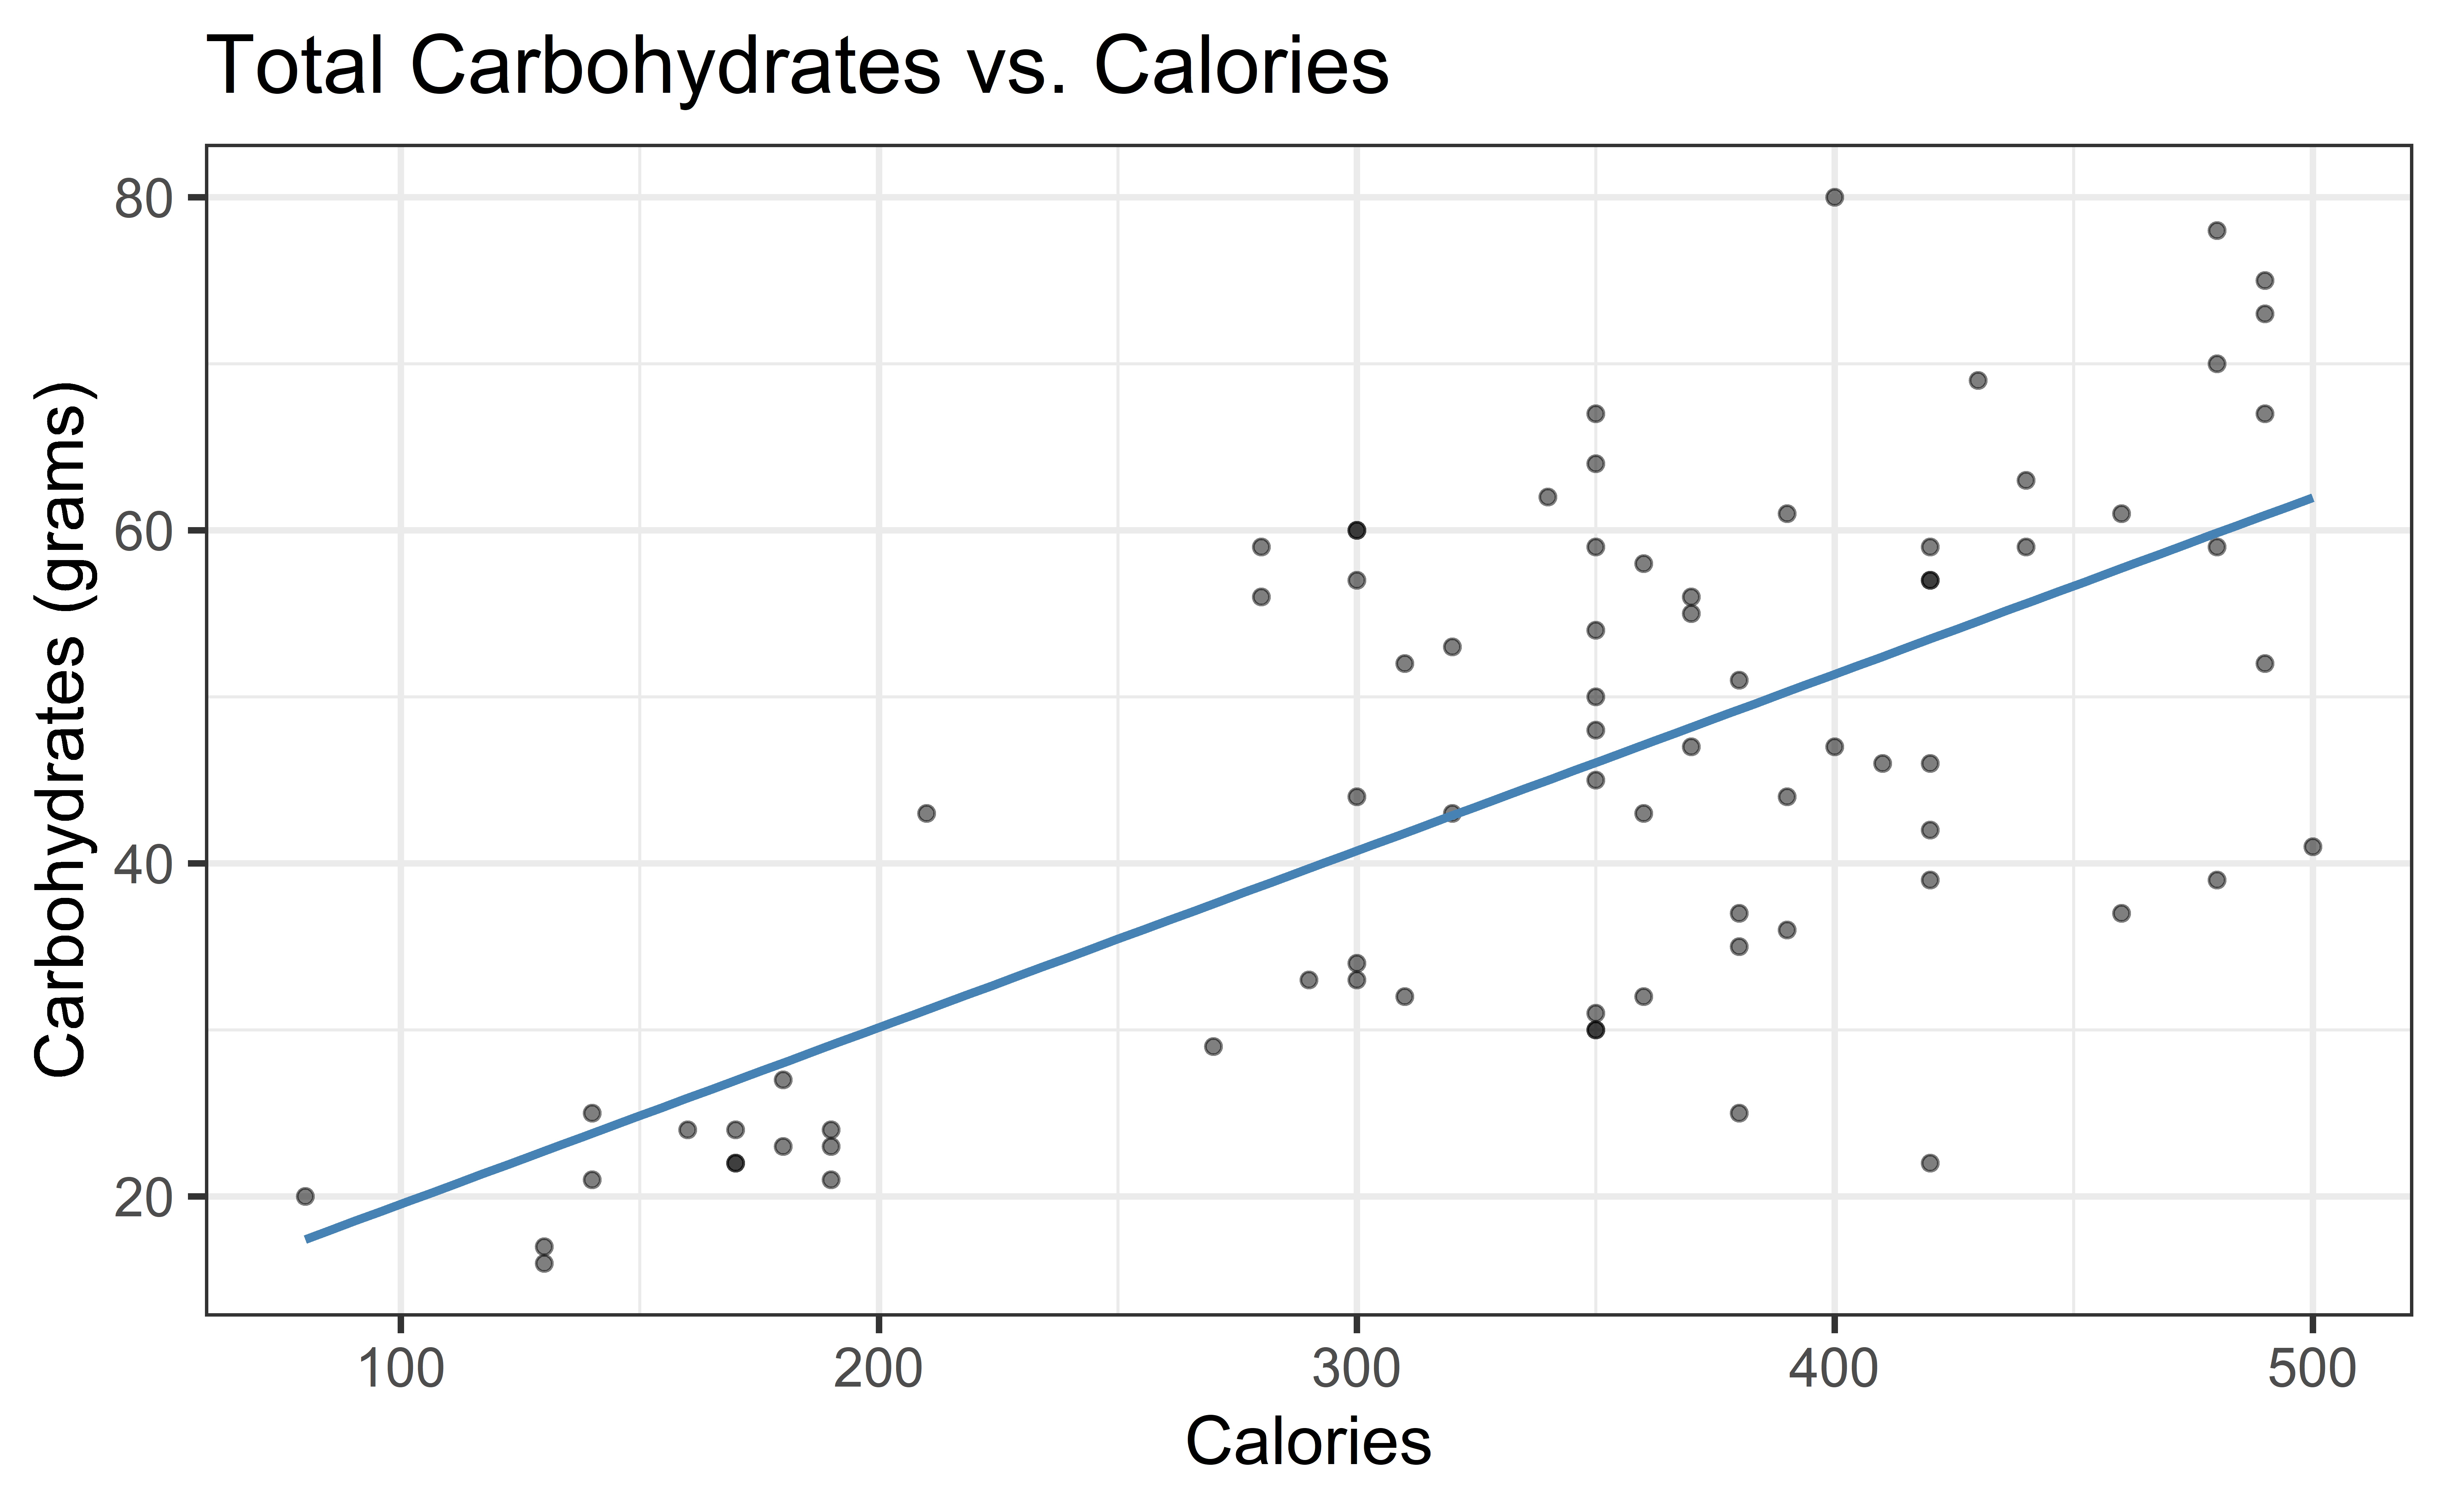
\[\text{carb} = \beta_0 + \beta_1 ~\text{calories} + \epsilon\]
Carb vs. Calories + Bakery
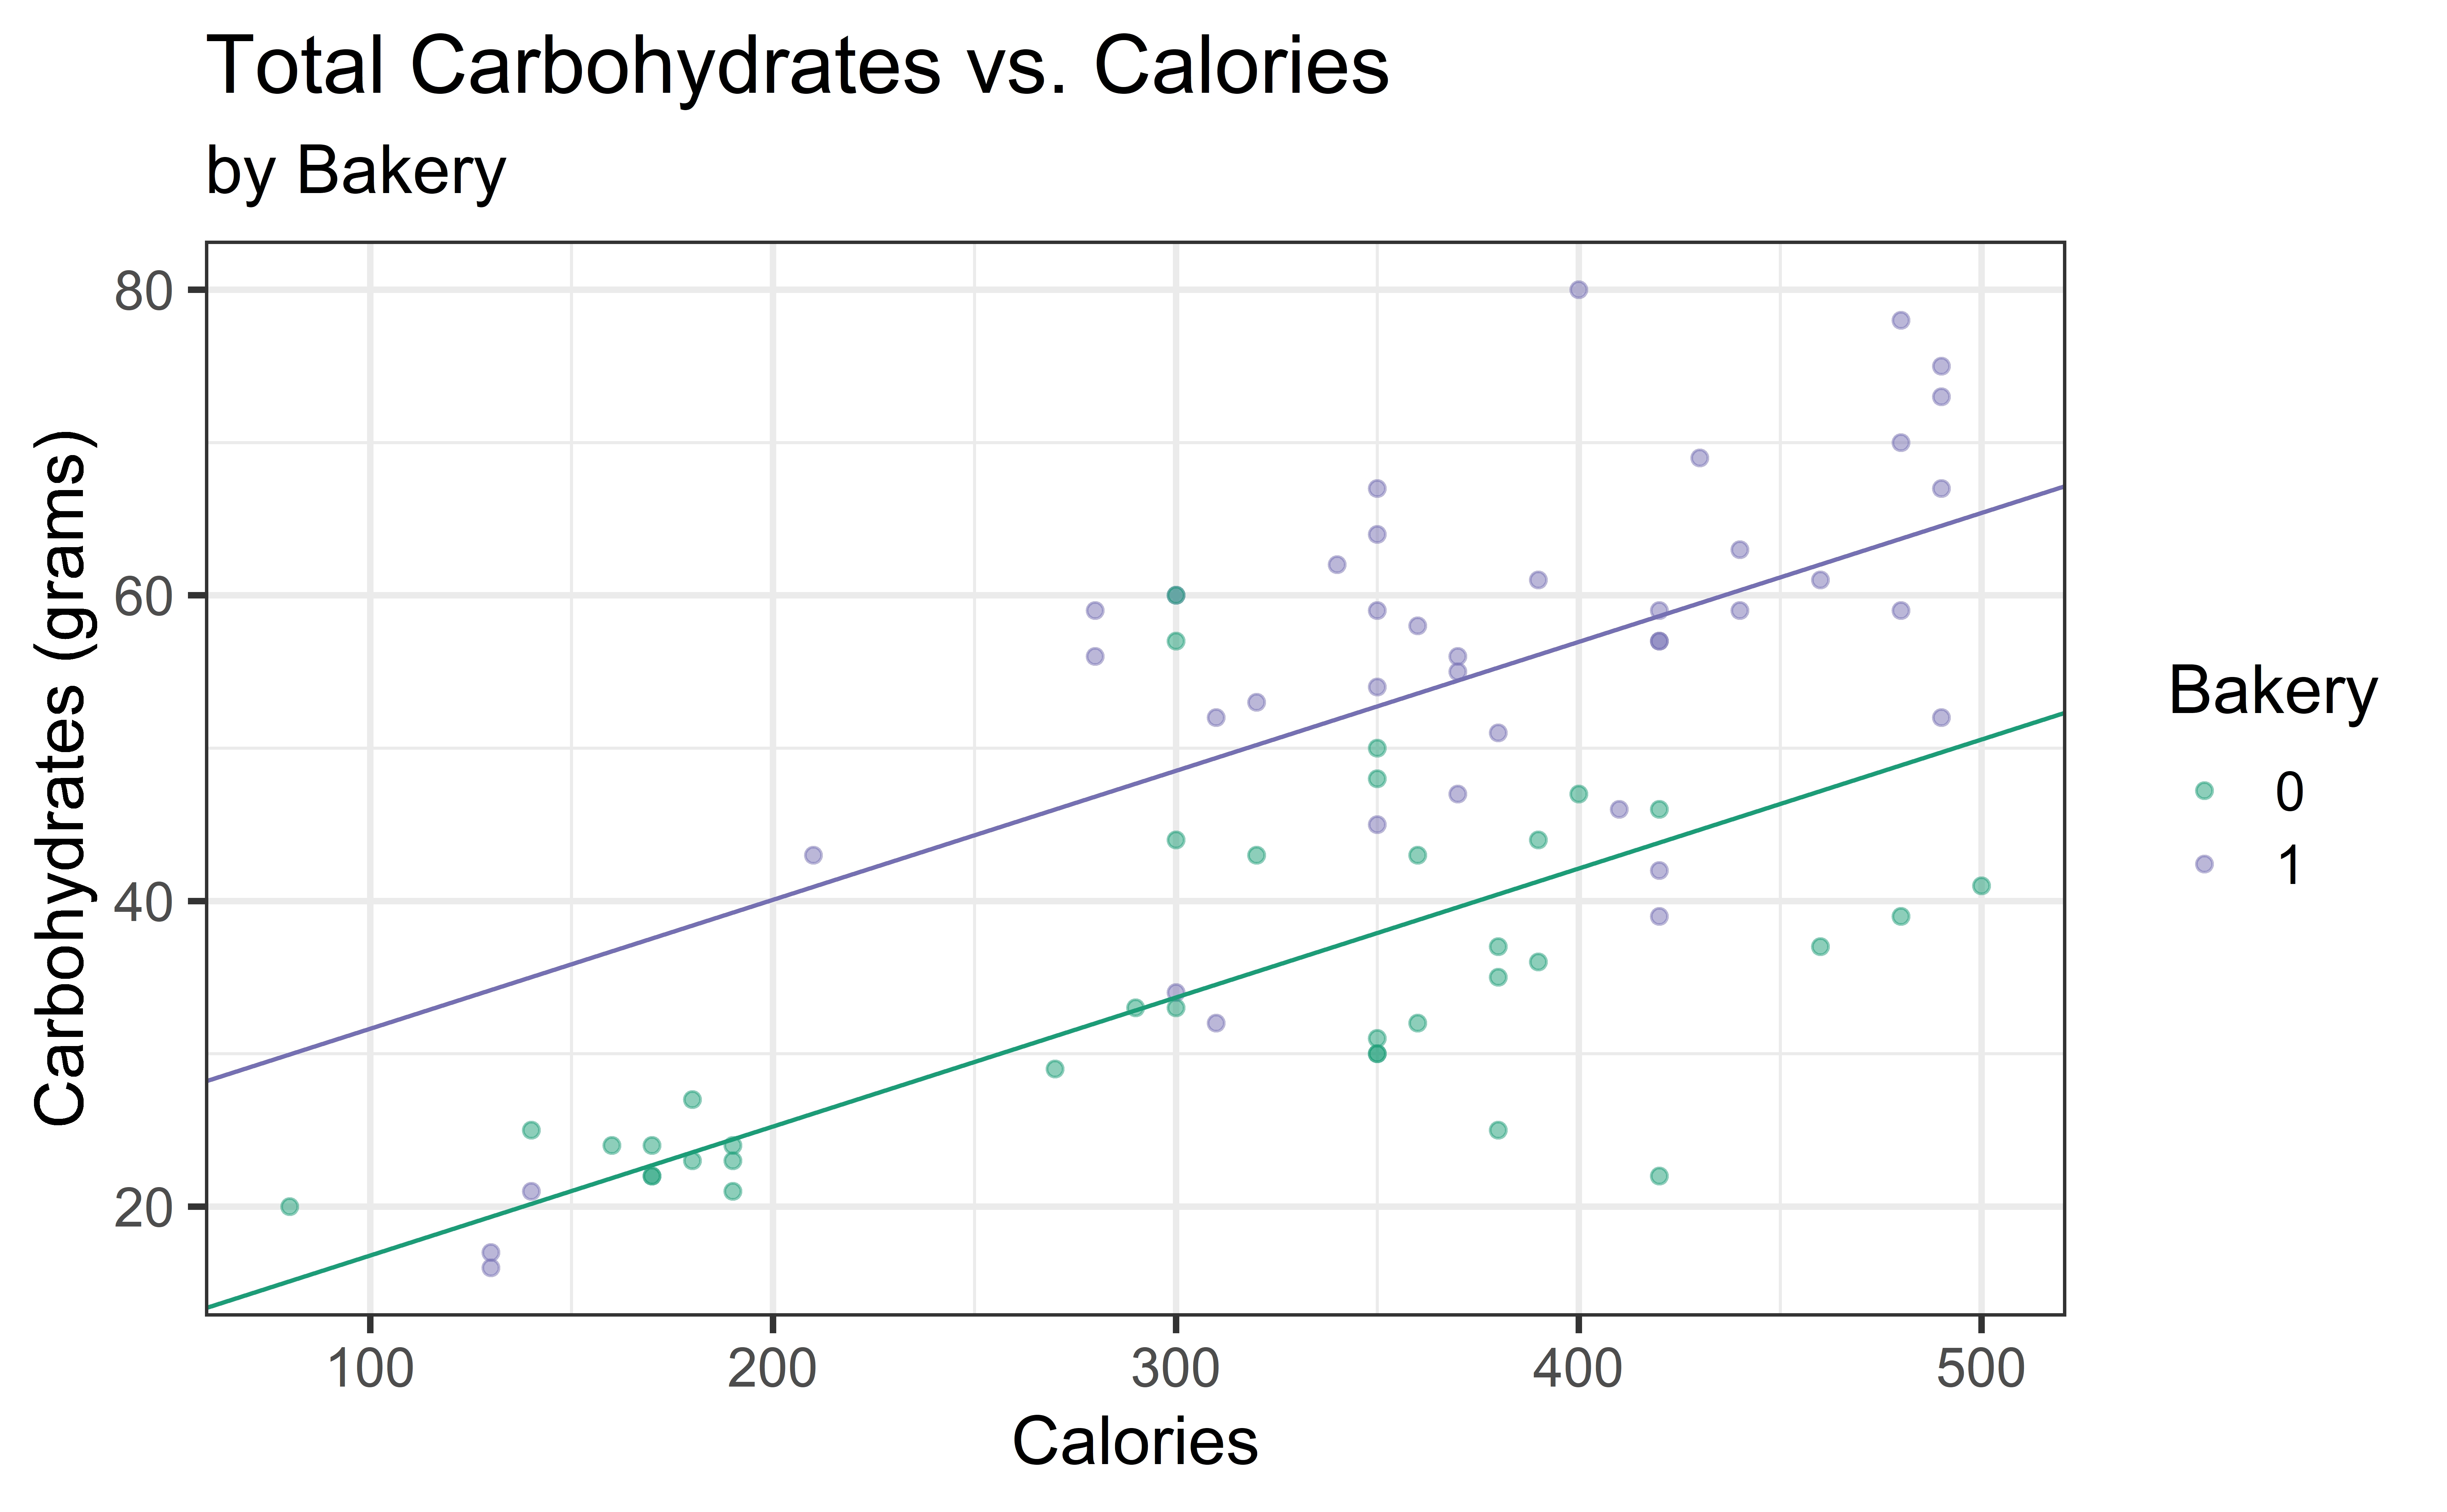
\[\text{carb} = \beta_0 + \beta_1 ~\text{calories} + \beta_2 ~\text{bakery} + \epsilon\]
Carb vs. Calories + Bakery (with interaction)
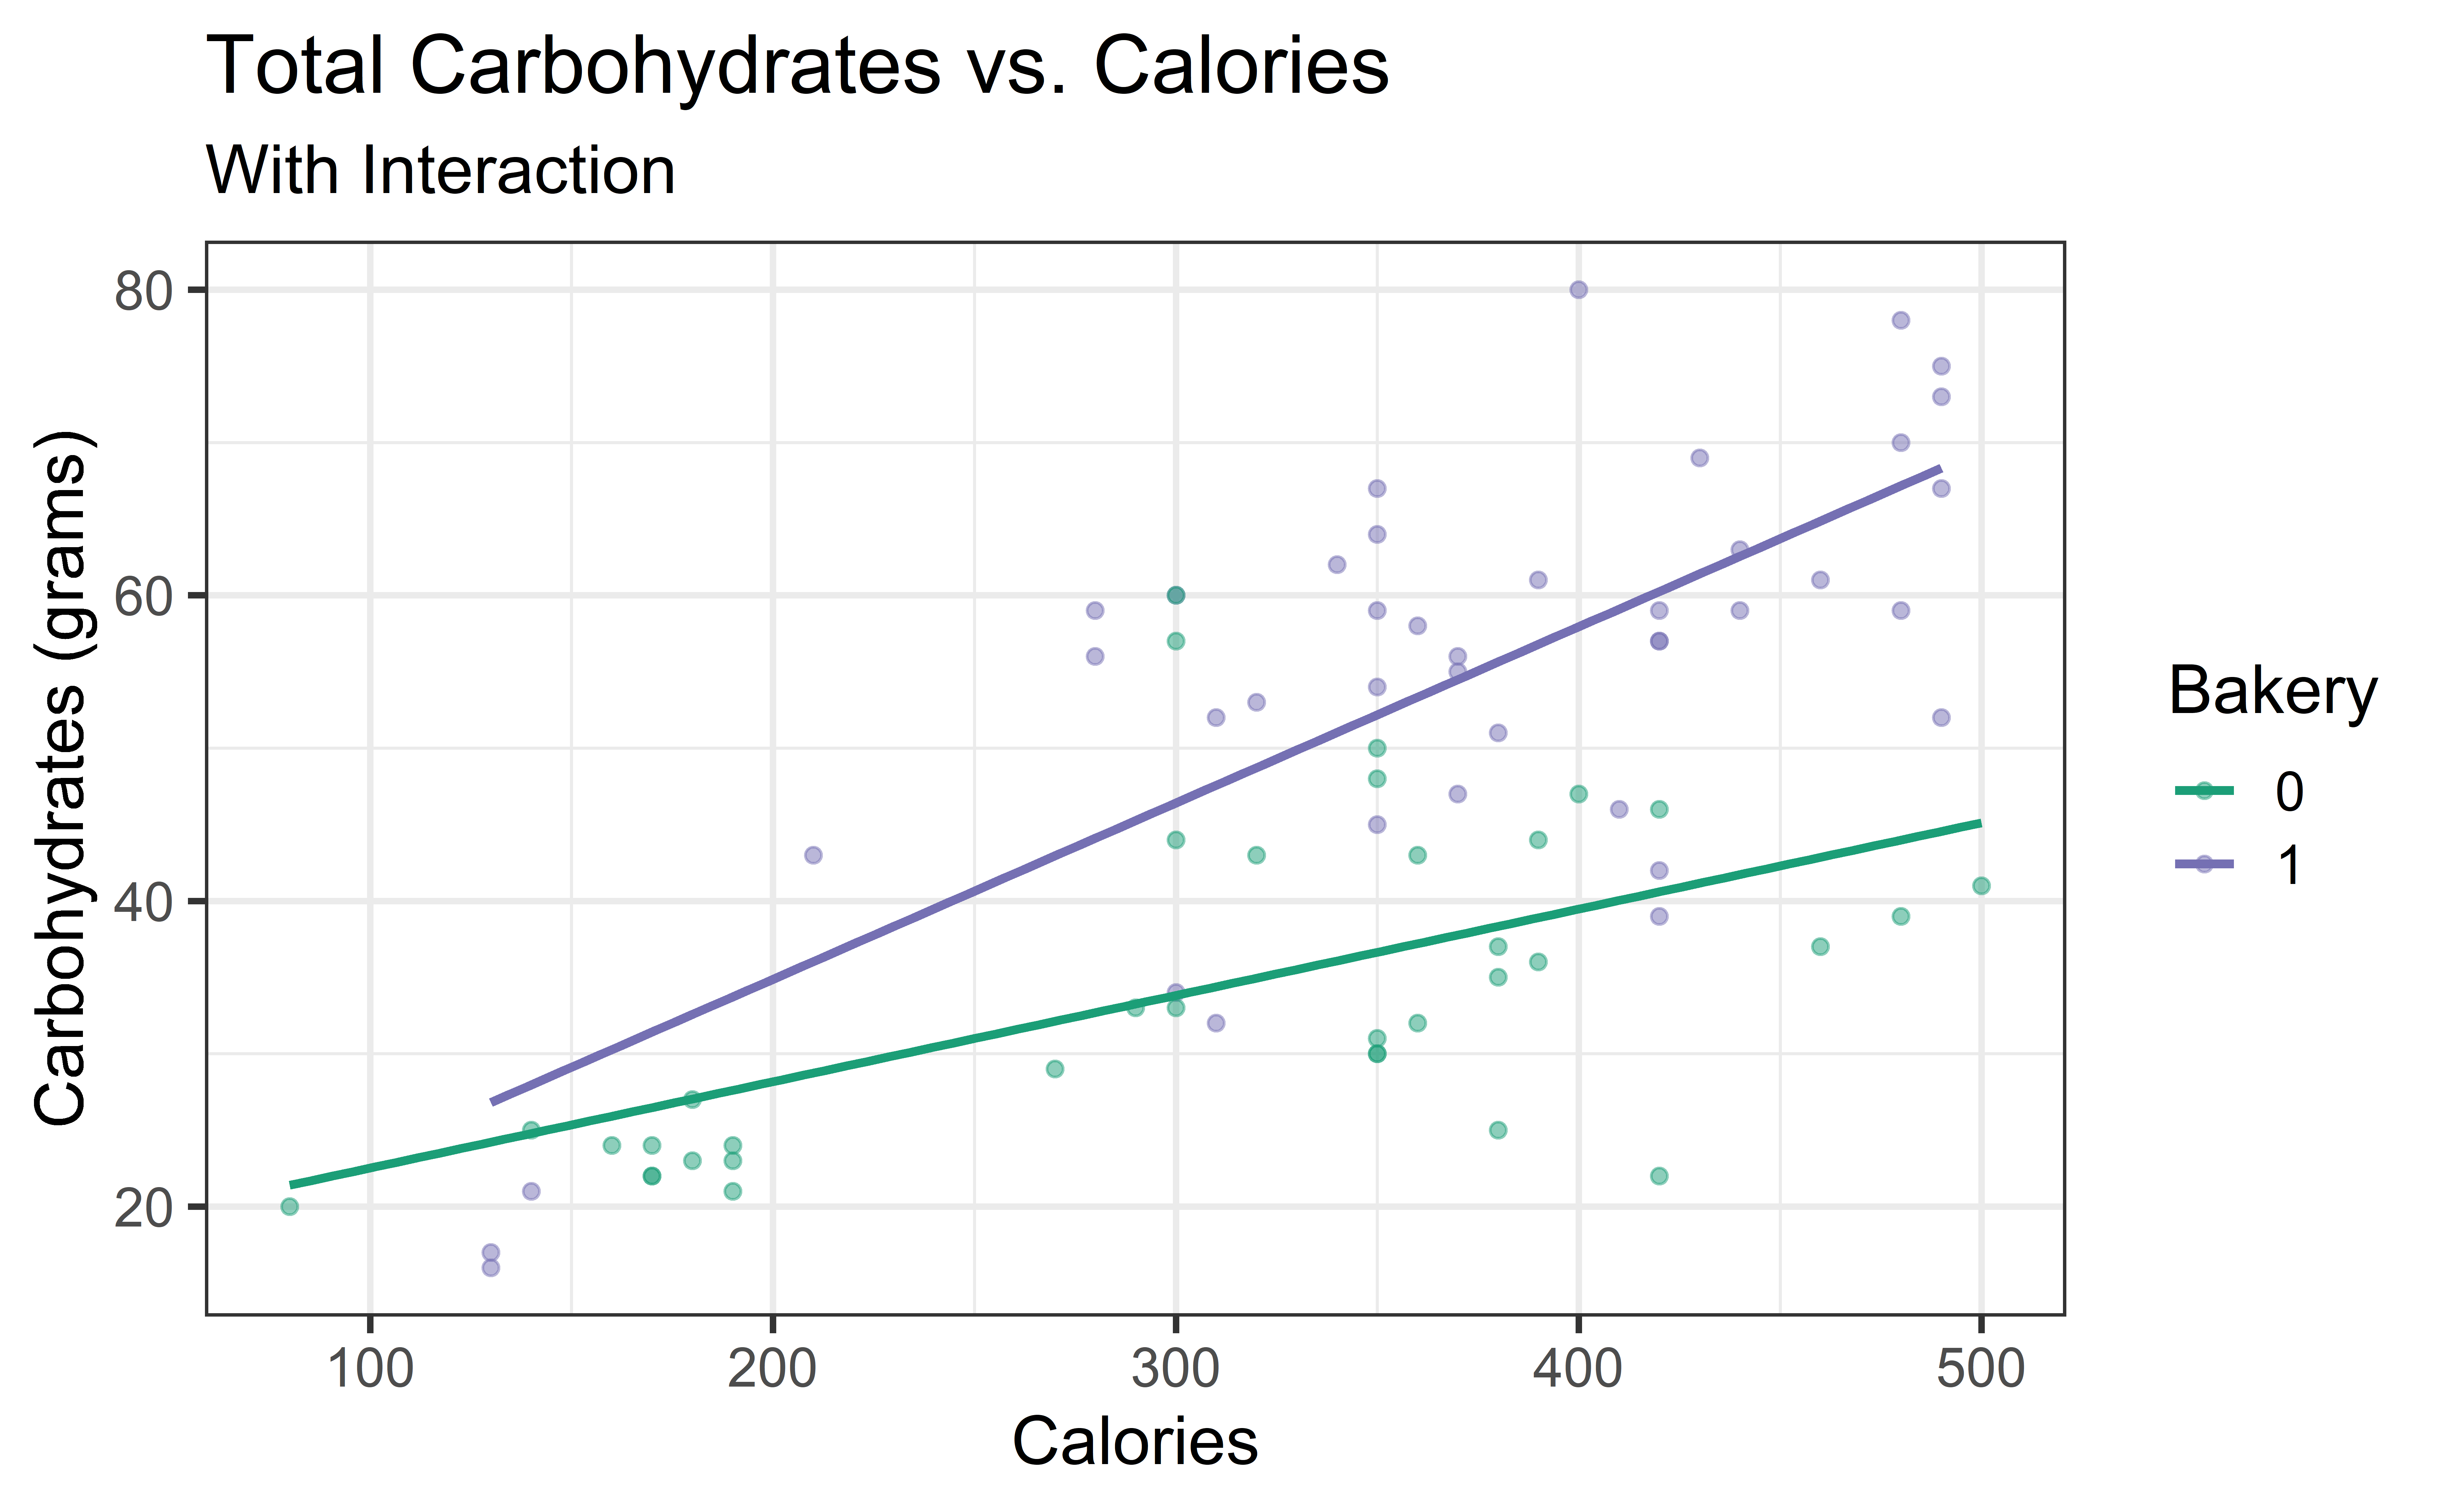
\[{\small \text{carb} = \beta_0 + \beta_1 ~\text{calories} + \beta_2 ~\text{bakery} + \beta_3 ~ \text{calories} \times \text{bakery} + \epsilon}\]
Simpson’s Paradox
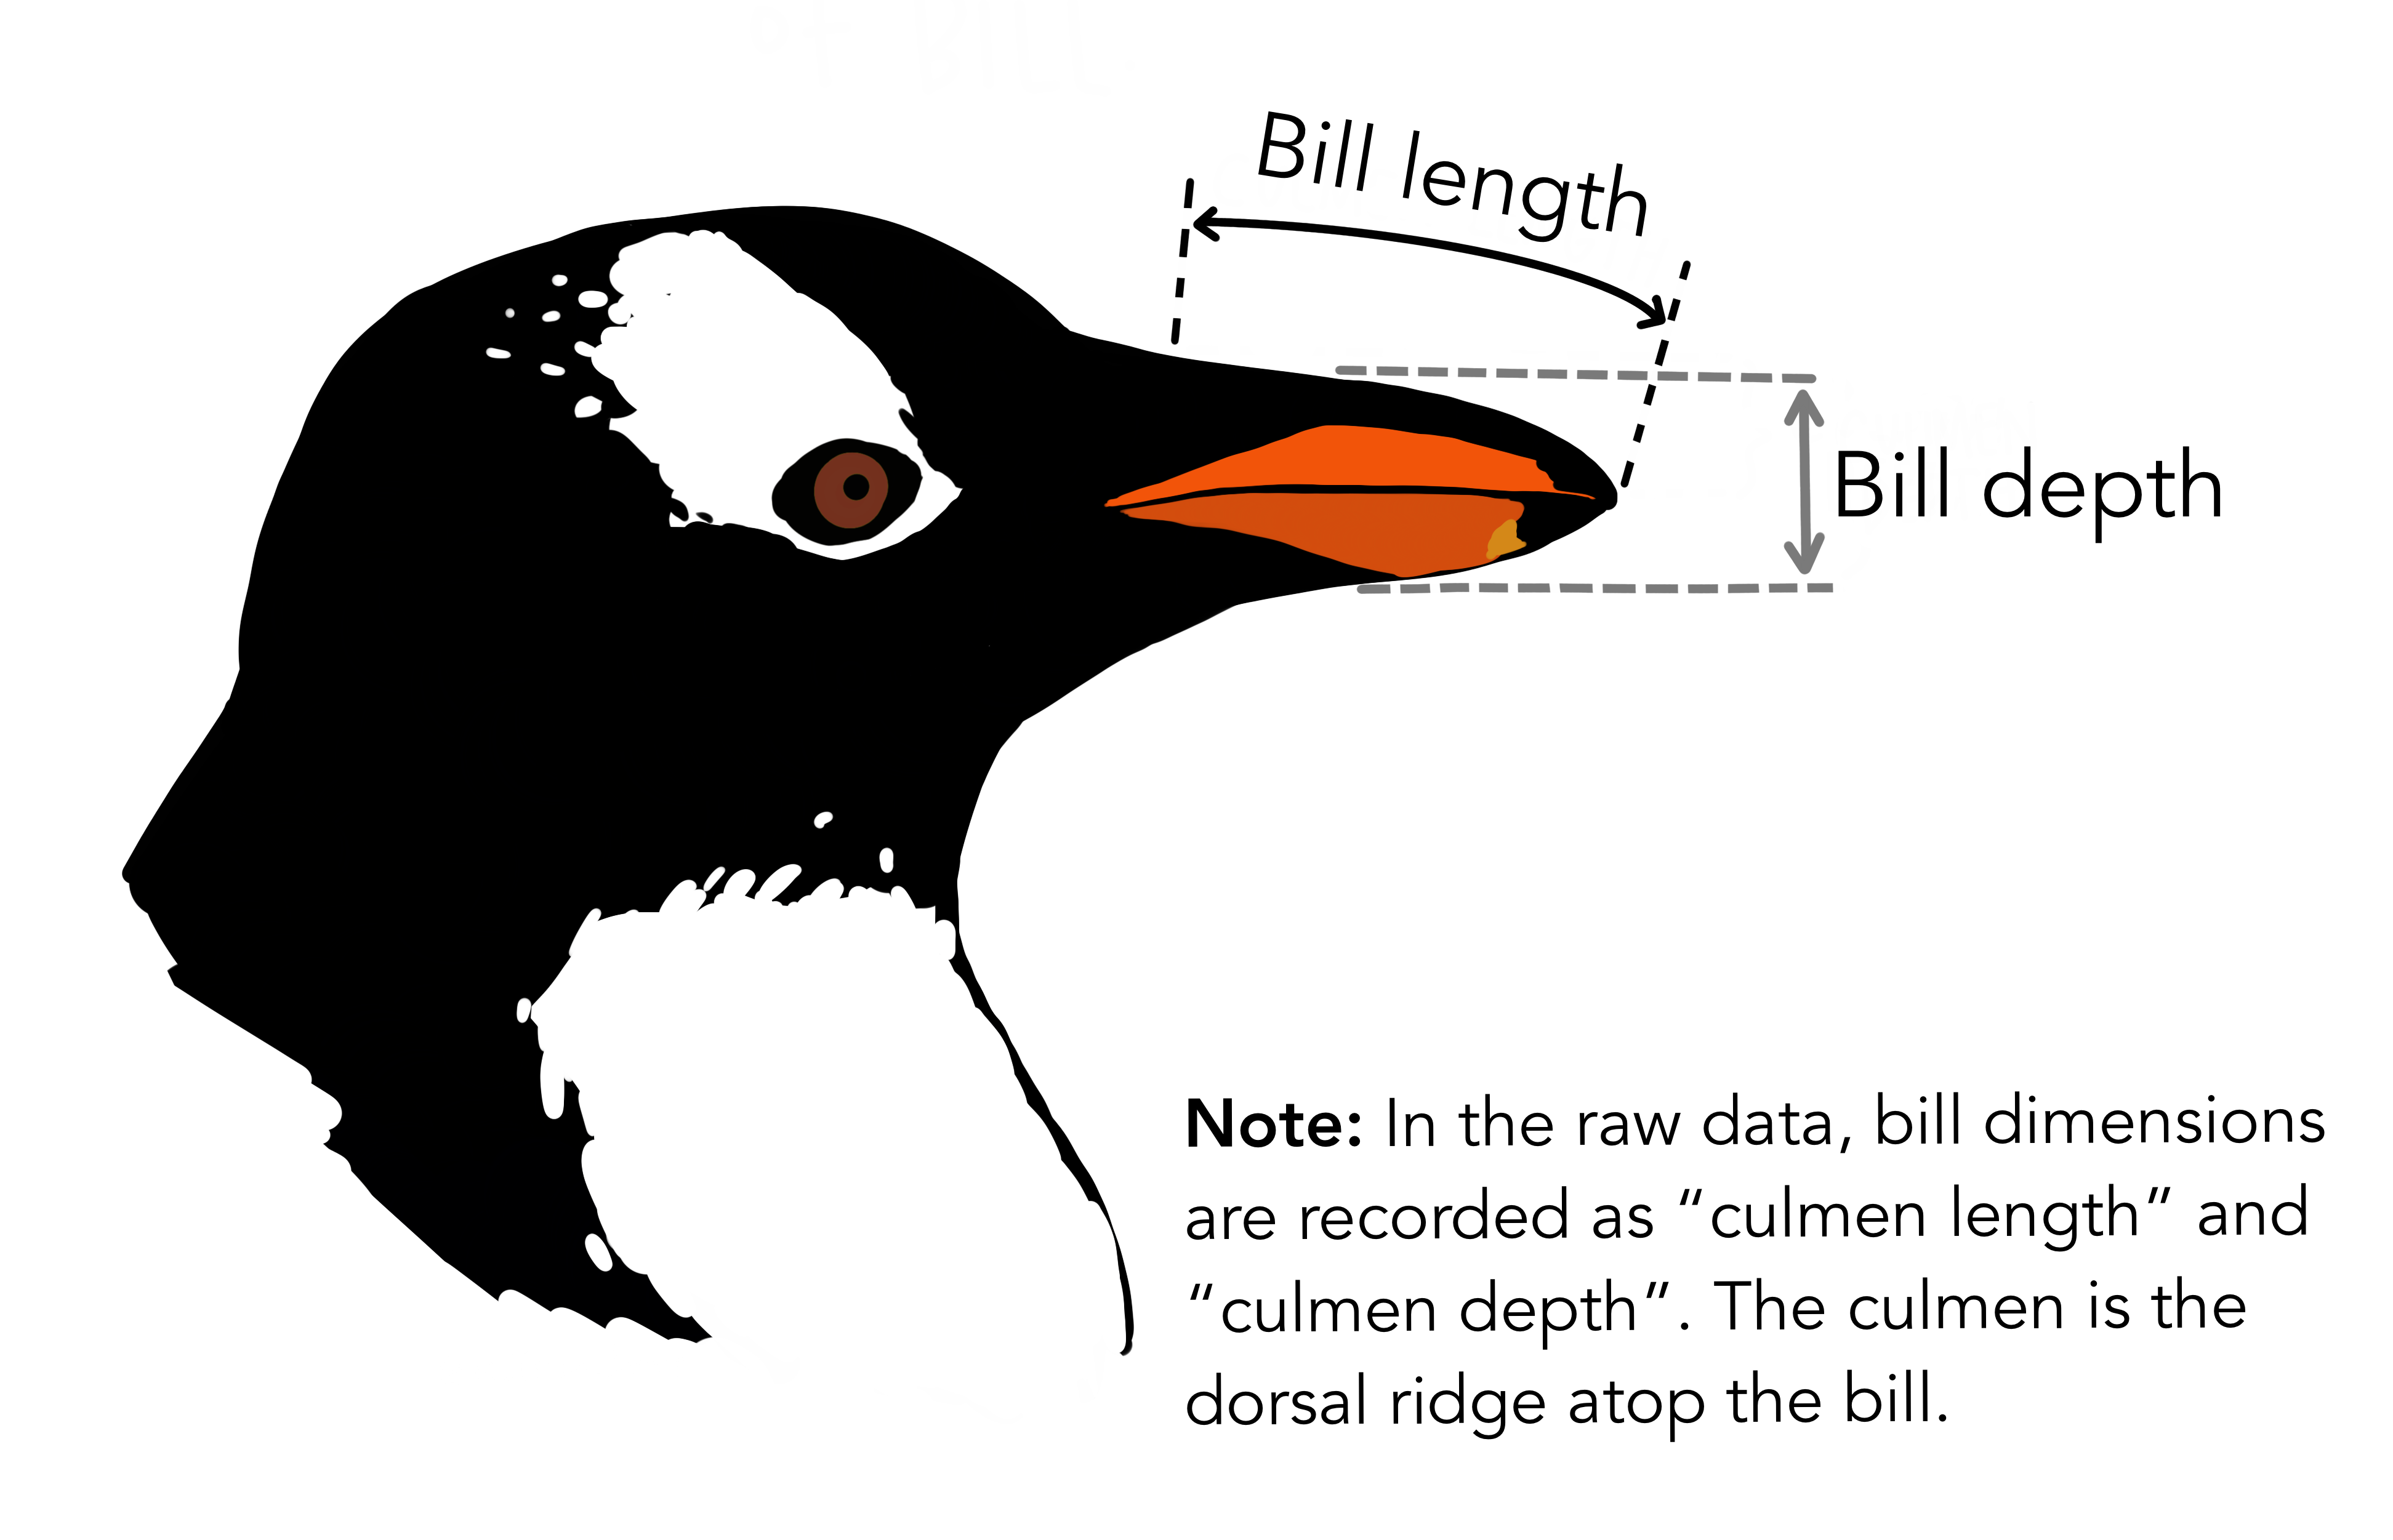
Example: Palmer’s Penguins
Size measurements, clutch observations, and blood isotope ratios for adult foraging Adélie, Chinstrap, and Gentoo penguins observed on islands in the Palmer Archipelago near Palmer Station, Antarctica.
Example: Palmer’s Penguins
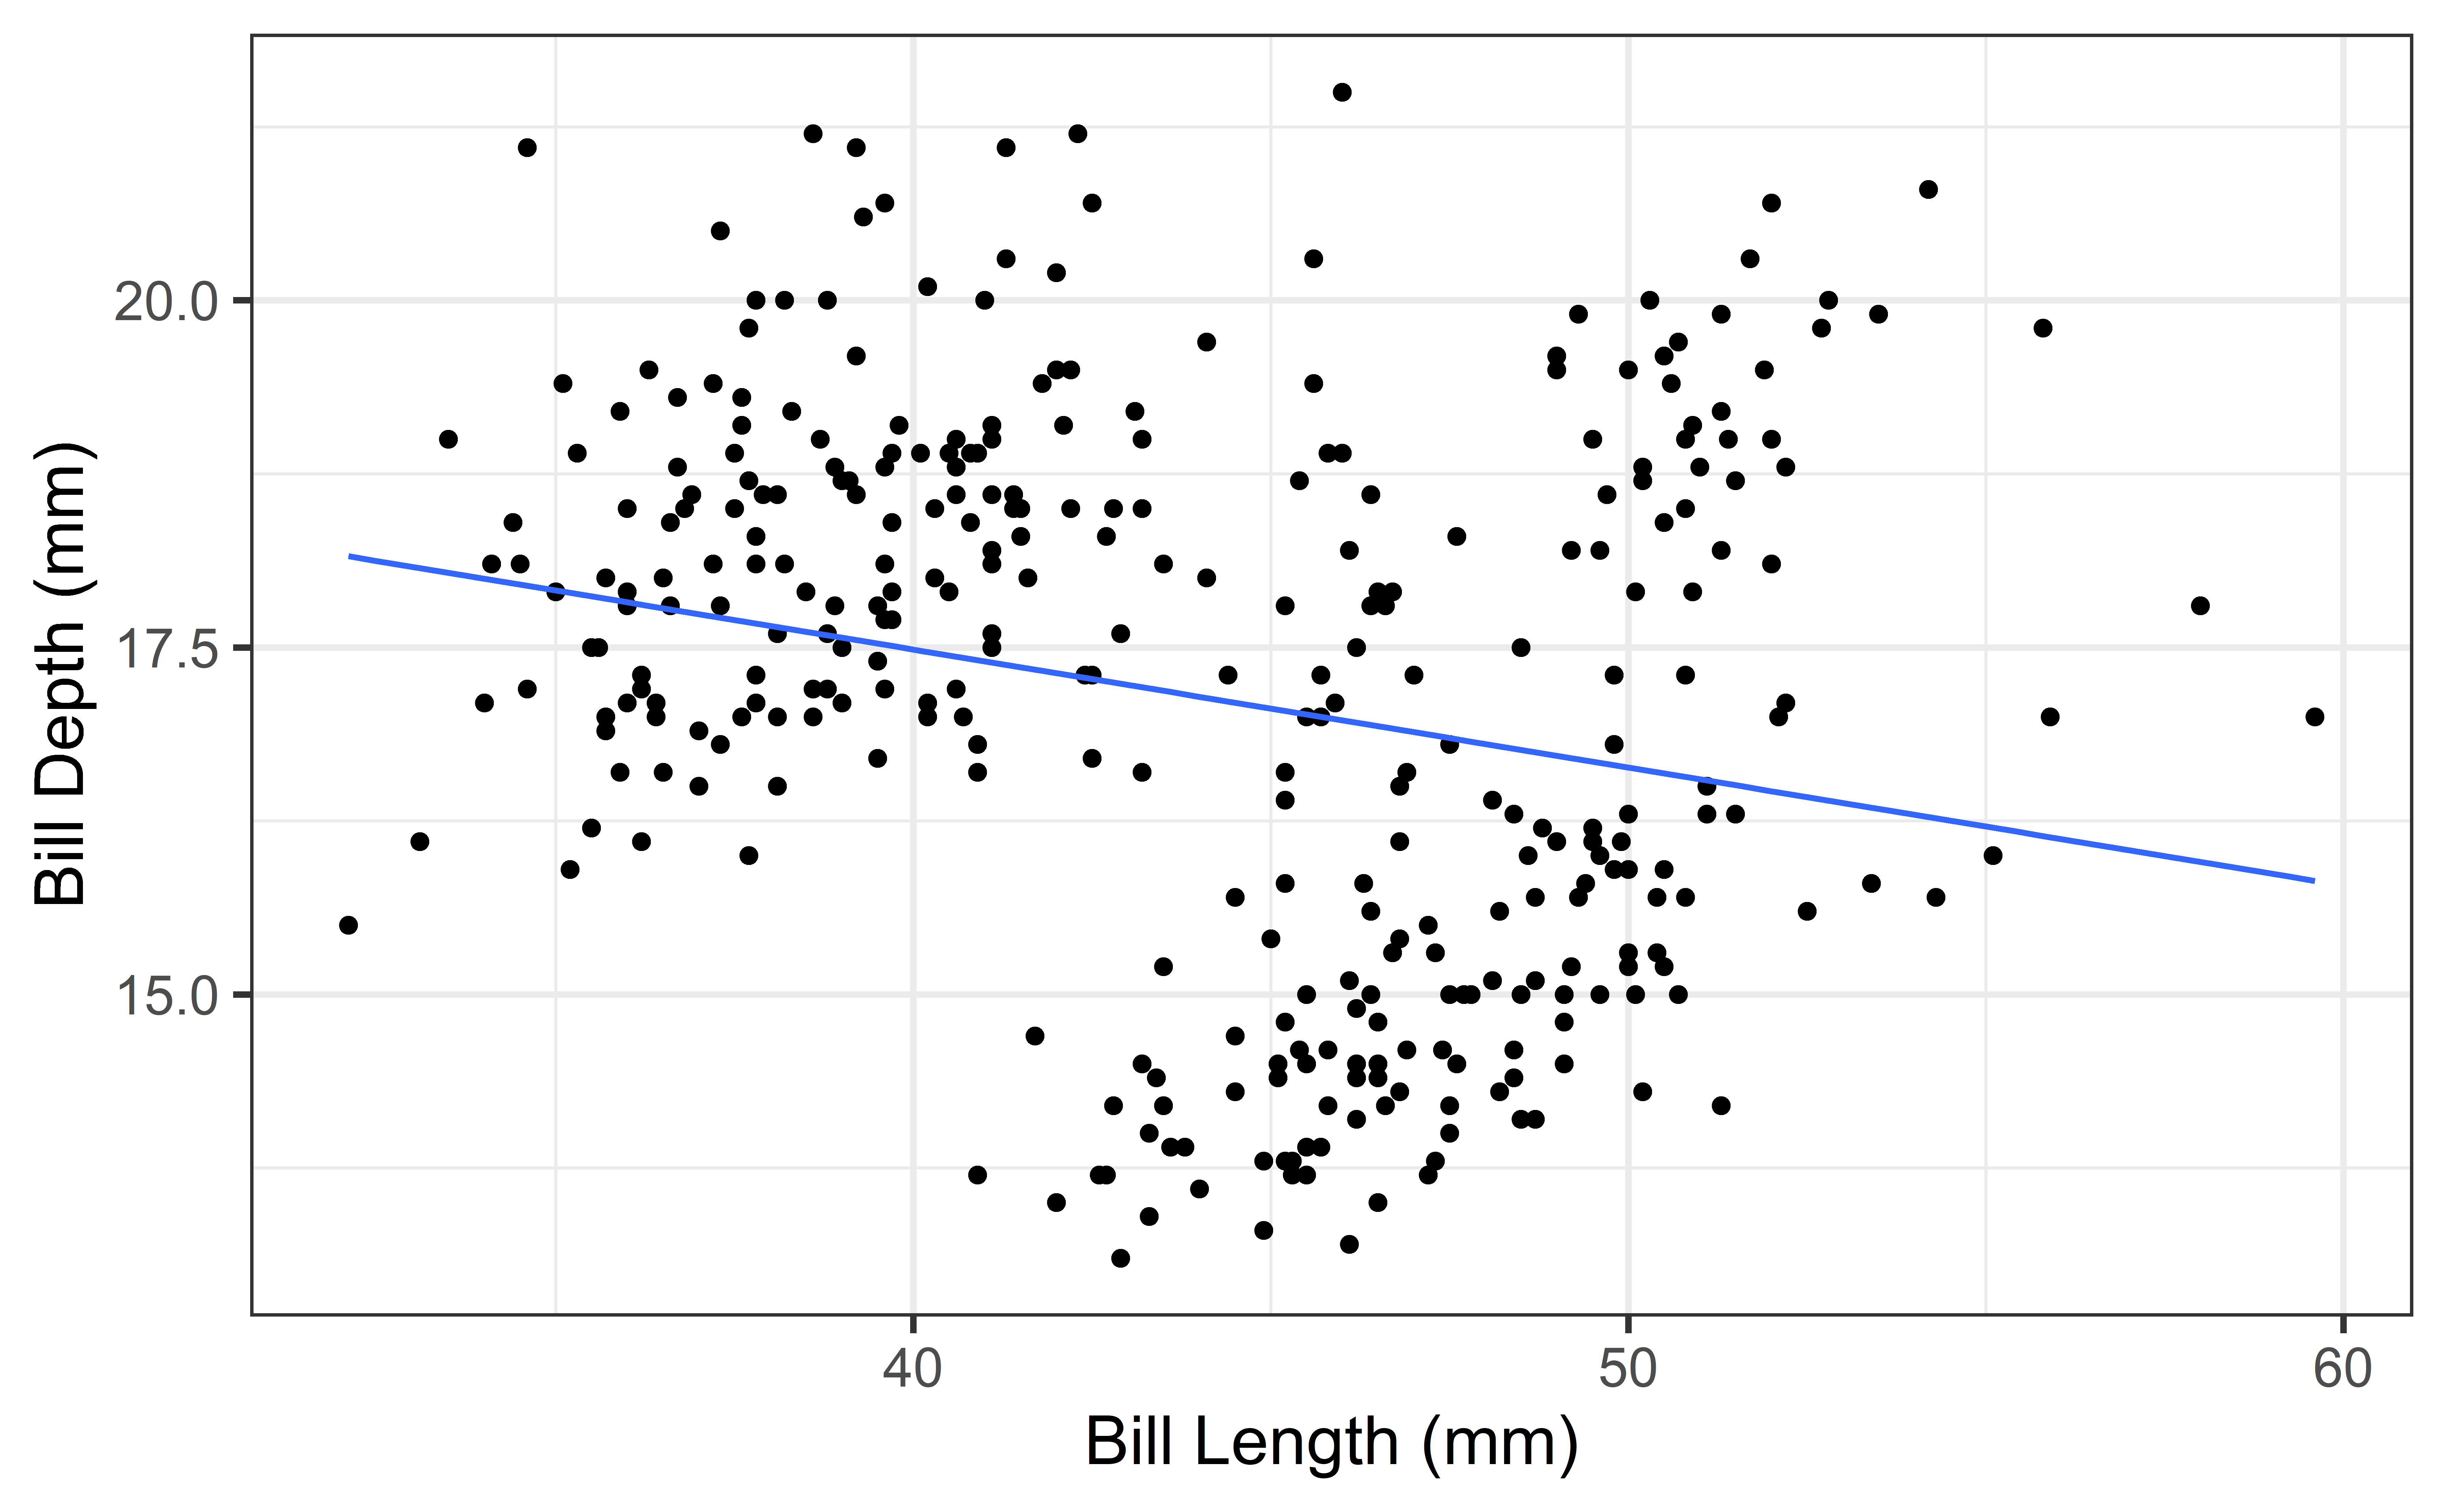
What does the relationship between Length and Depth look like?
Example: Palmer’s Penguins
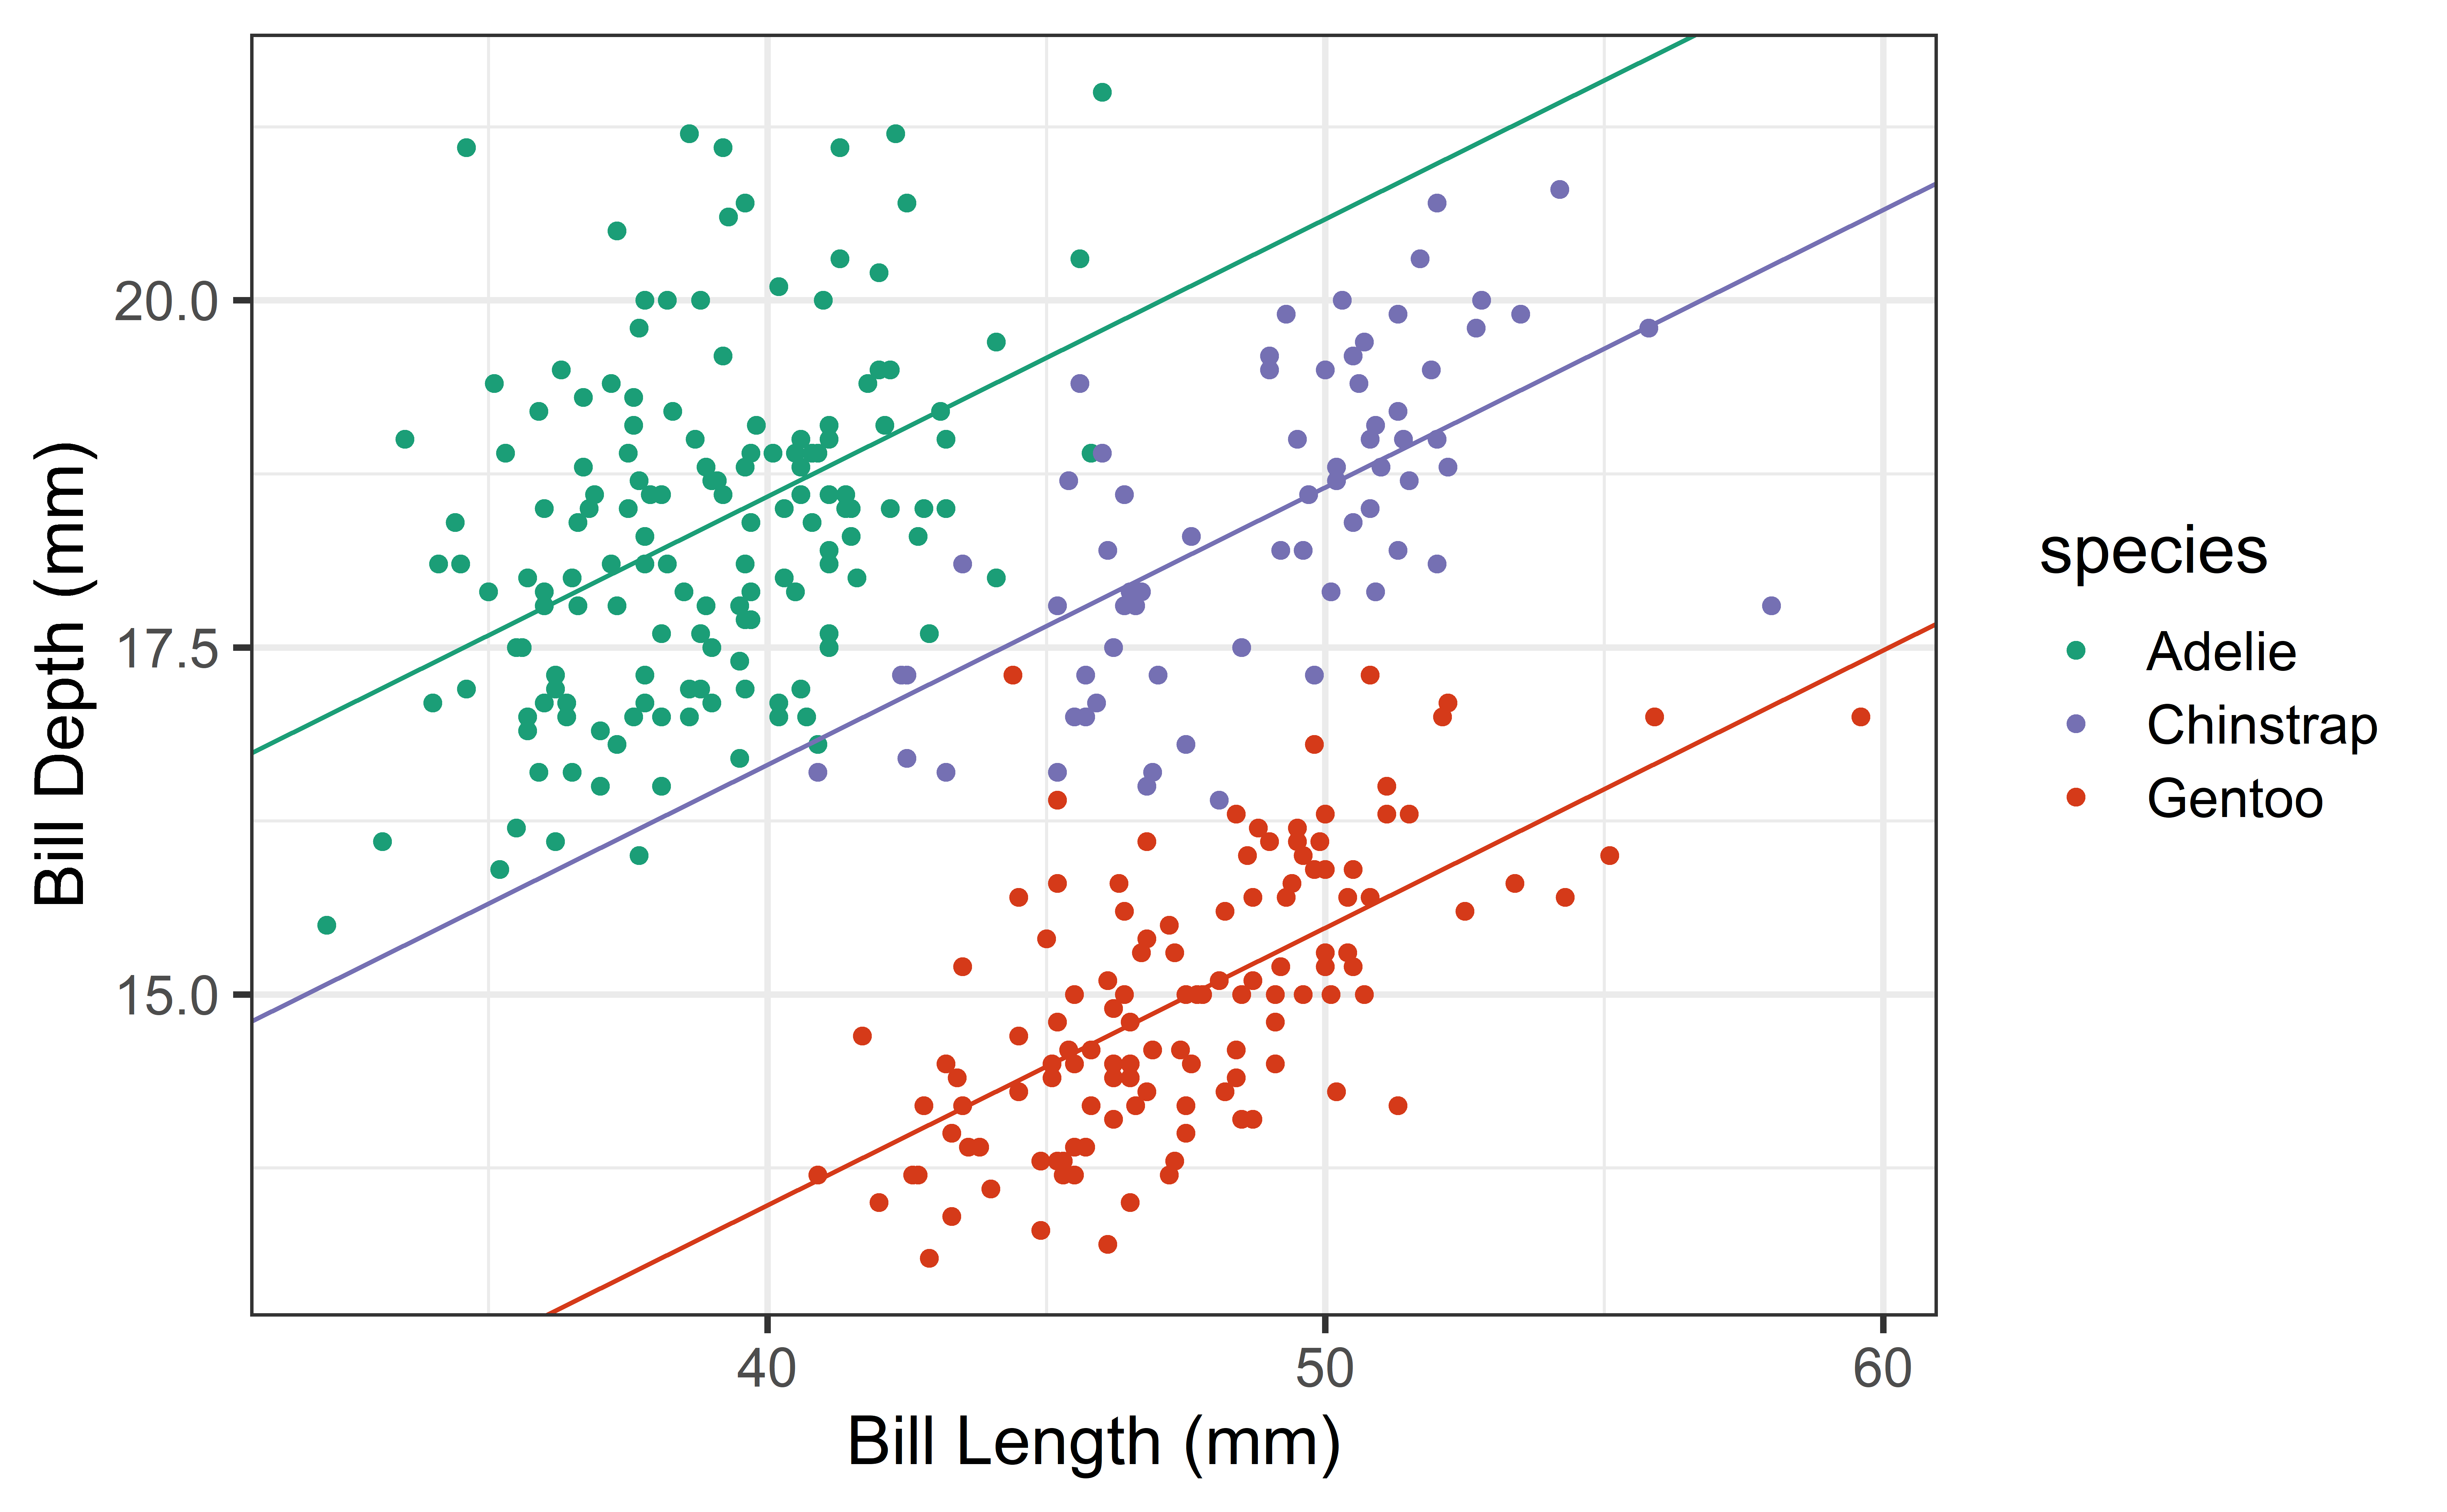
What does the relationship between Length and Depth look like now?
Simpson’s Paradox
Simpson’s Paradox is when there is a clear relationship between two varibles but when you introduce a third variable that relationship disappears of reverses.
Statistical model vs. regression equation
Statistical model (also known as data-generating model)
\[{\small \text{carb} = \beta_0 + \beta_1 ~\text{calories} + \beta_2 ~\text{bakery} + \beta_3 ~ \text{calories} \times \text{bakery} + \epsilon}\]
Models the process for generating values of the response in the population (function + error)
. . .
Regression equation
Estimate of the function using the sample data
\[{\small \hat{\text{carb}} = \hat{\beta}_0 + \hat{\beta}_1 ~\text{calories} + \hat{\beta}_2 ~\text{bakery} + \hat{\beta}_3 ~ \text{calories} \times \text{bakery}}\]
Why fit a model?
Prediction: Expected value of the response variable for given values of the predictor variables
Inference: Conclusion about the relationship between the response and predictor variables
What is an example of a prediction question that can be answered using the model of carb vs. calories and bakery?
What is an example of an inference question that can be answered using the model of carb vs. calories and bakery?
Recap
We can use exploratory data analysis to describe the relationship between two variables
We make an assumption about the relationship between variables when doing linear regression
The two main objectives for fitting a linear regression model are (1) prediction and (2) inference
Rest of class
- Work on HW 0!
References
Footnotes
Source: Mayo Clinic↩︎